Part I explained necessary terminology to understand centrifugal operations. Part II reviews typical operating performance curves and how to interpret them.
A centrifugal air compressor operates over a range of flows and discharge pressures. The operating performance curve is shaped by the selected individual internal components and affected by operating conditions such as inlet pressure, inlet temperature, and cooling water temperature.
The process of dynamic compression, as applied in a centrifugal compressor operating stage, is velocity and kinetic energy converted to pressure and temperature as the flow is restricted. Another term for this process is mass flow – the power requirement to deliver the rated cfm of flow at the rated pressure (psig) is determined by the weight of the air (some manufacturers also use the term “density”).
The power requirement in this type of compression process, when the internal design parts are not considered, is basically dependent on the weight of the air going through the machine. Ignoring part loads controls anything that will increase or decrease the weight of the air going through the stages to final flow, and pressure will have a direct impact on input power.
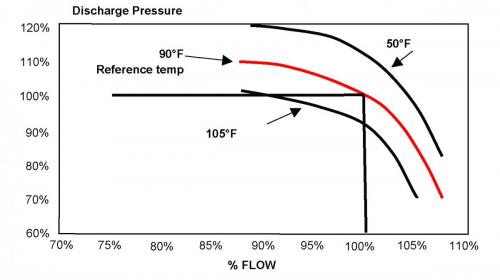
Figure 1a. Effect of inlet air temp on discharge pressure
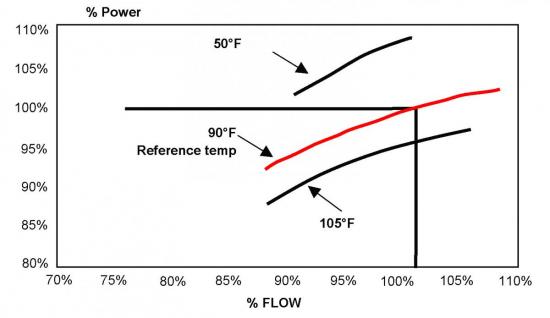
Figure 1b. Effect of inlet air temp on power
Increasing the inlet temperature will lighten the total fixed air flow and deliver less usable air to the user (scfm) and reduce the input power requirement. Colder temperatures will produce the opposite effect.
Reducing the inlet pressure (altitude, negative compressor room pressure, dirty/poorly sized inlet filter) will lighten the compressed air flow (cfm) that travels through the stages also resulting in less usable air (scfm) at a reduce input power requirement. Higher inlet pressure will have the opposite effect.
Increasing the cooling water temperatures will again have the same “lightening” effect on the compressed air through the stages and power requirements as the previous conditions.
The actual net effect of any of these conditions is dependent on the actual performance curve and aerodynamic characteristics of the design. This is also the case of discharge pressure with a fixed wheel, or impeller/diffuser/speed, compressor stage.
Increasing the discharge pressure will normally leave the effect of raising the weight of the compressed air stream through the stages which will result in less flow of usable air (scfm) often at or near the same input power. Lowering the pressure will often allow more flow at the same or similar power input. Actual machine specific performance is covered later in this document.
Understanding Centrifugal Manufacturer Operating Curves
Data should be equalized to:
- SCFM or Nm3/hr at full and part loads
- Input power at kW
- Pressures either in psig or bar (only using psia to convert from icfm/acfm to scfm)
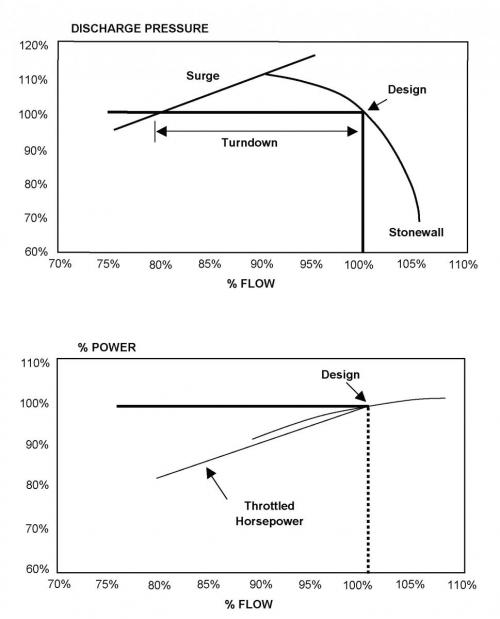
Figure 2. Typical centrifugal performance curves
What are Turndown, Stonewall, and Rise to Surge?
Once an impeller is designed and a speed set, the energy that a pound of air will absorb in passing through the impeller is established.
A centrifugal compressor will deliver a pound of air with a constant expenditure of energy -- winter or summer. The actual volume of inlet air to be compressed will vary for a period of time with the inlet condition of pressure and temperature.
Rise to Surge: As more compressed air is produced than needed, the centrifugal compressor must unload, or deliver less air to avoid over pressure. Each centrifugal compressor has a maximum pressure it can reach for specific inlet conditions which will cause the air flow to reverse and surge, shutting off the compressor to avoid damage from the vibrations.
This is an oversimplification of the surge action, however, each unit has a rise to surge limit or maximum pressure. Turndown is the percentage below full load flow the compressor can run without experiencing surge. For example, 15% turndown means the unit can run at 85% flow or higher, as equipped without hitting surge. At greater turndown, it will be close to or at surge.
Stonewall: At some point, as the discharge falls and the air flow through the increases at full load, the physical limitations will not allow more air through the stages – this point is known as stonewall. Continued operation at or beyond this point can cause such high flow rates with greater pressure differential that the impellers will not totally fill the vane areas and a cavitation-like action will occur creating another type of surge with potentially damaging vibrations.
Figure 3 is a sample representation of a general manufacturer’s performance curve and the data can be developed to a predictable and probable actual projected operating efficiency.
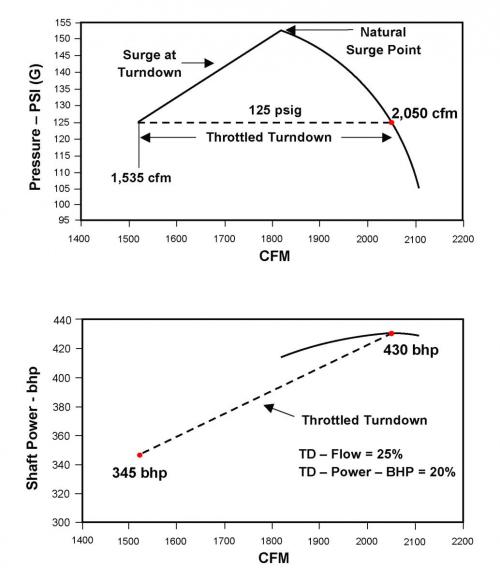
Figure 3. Sample performance curves for full load compressor at 125 psig
- 2,050 cfm at 125 psig at 430 HP (x .7457 = 321 kW)
- Turndown 1,535 cfm at 125 psig at 345 HP (x .7457 = 257 kW)
Utilizing the Centrifugal Operating Performance Curves for System Optimization
Working with an OEM supplier and their operating performance curves effectively will help to lead to a successful application. In order for the user to provide the OEM supplier the appropriate data, the user should be familiar with the information presented to fully understand and ask for significant additional data such as:
- What are the operating characteristics of the impeller/diffuser with regard to surge point, turndown, specific power full load, etc.
- What are the set of standard impeller/diffuser for more turndown capability?
Capacity Controls and Inlet Guide Vanes
The operating performance curves in Figure 4 show there were two different part load input kW values for the inlet butterfly valve (IBV) and the inlet guide vane (IGV). Like all things in centrifugals, the actual data is machine specific.
Why is All This Meaningful?
When the centrifugal compressor as designed and applied runs out of turndown, it cannot keep producing compressed air that the system cannot take so basically one of two things happen:
- A capacity control available from almost all manufacturers unloads the compressor by closing the inlet valve and opening the blow off valve, allowing the unit to go to idle at a reduced input power with no air flow.
A further refinement allows the motor to shut off; the larger the induction motor the fewer starts per hour or per day. This type of control can be very effective and is also storage dependent because the reload and or restarting of the 100 psig class unit can take up to 1 minute or more. High pressure (500 to 550 psig) units can take up to 3 more minutes to get to full load.
- The most commonly used capacity control is the blow off. When the unit reaches its full turndown (as adjusted) the blow off valve opens and blows off excess capacity to atmosphere. The input kW will no longer reduce at all regardless of whatever air demand reductions occur.
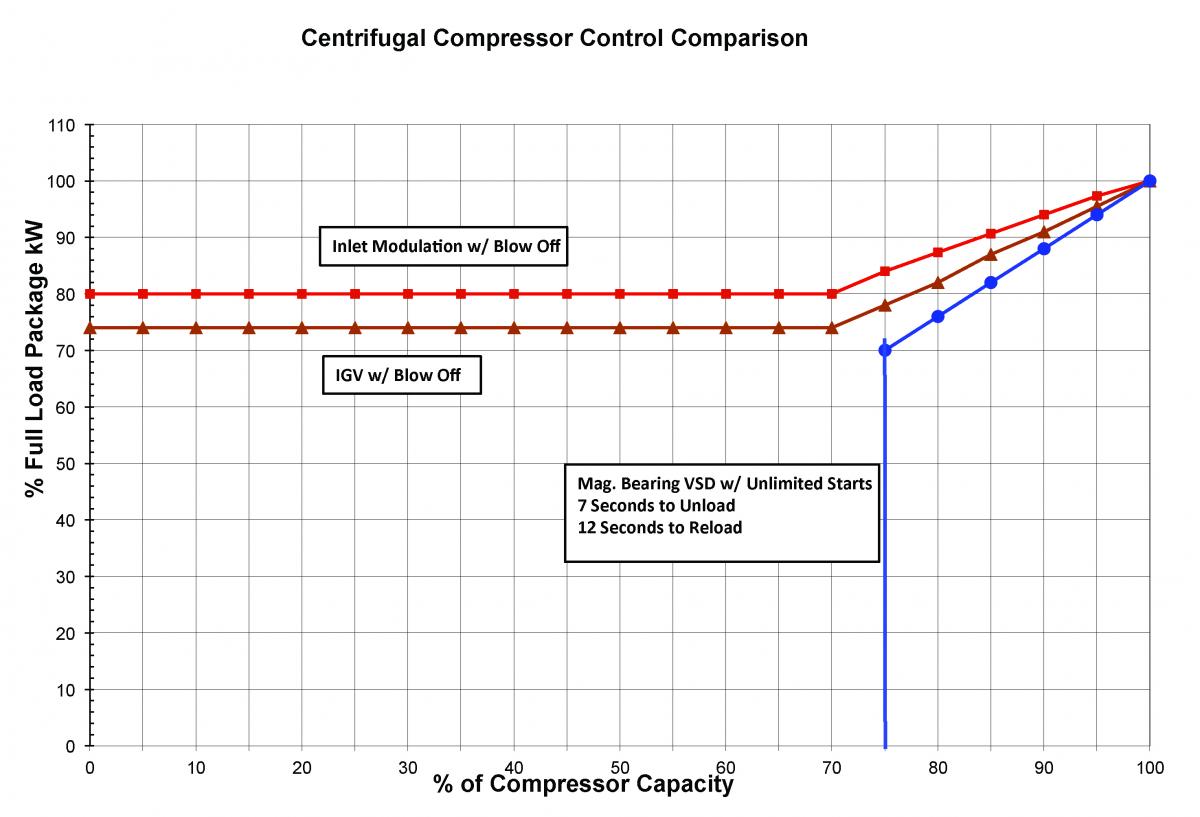
Figure 4. Centrifugal compressor control comparison
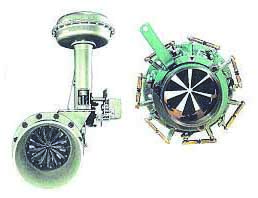
Typical Inlet guide vanes
Figure 4 shows the DOE (Department of Energy) generated performance curve for the standard IBV (inlet butterfly valve) or IGV (inlet guide vane) inlet controls with a nominal 30% turndown.
The IGV’s do not allow more turndown but they do allow turndown at better efficiency by reducing the turbulence losses of the air entering the impellers.
The third curve shown on Figure 4 represents a new centrifugal drive technology with magnetic bearing motors. This control is very effective VSD (variable speed drive) from 100% to 75% with the input power directly proportional. At full turndown the unit fully unloads in 7 to 12 seconds and can be loaded in 12 to 15 seconds. Effective operation requires appropriate storage.
What About Cooling Water Discharge Pressure?
Table 1 shows a single units projected performance at 85°F cooling water and 60°F cooling water at different discharge pressures.
Table 1. Unit with 135 psig Natural Surge Point at 85°F coolant and 60°F coolant
|
Standard Conditions |
Estimated |
Estimated |
Estimated |
|
|
Gas |
Air |
Air |
Air |
Air |
|
Psia Ambient |
14.4 psia |
14.4 psia |
14.4 psia |
14.4 psia |
|
Psia Intake |
14.1 psia |
14.1 psia |
14.1 psia |
14.1 psia |
|
Temperature In |
95°F |
95°F |
95°F |
95°F |
|
Temperature Coolant |
85°F |
60°F |
60°F |
60°F |
|
RH% |
60% |
60% |
60% |
60% |
|
Psig Out |
125 psig |
100 psig |
105 psig |
110 psig |
|
Flow |
1,572 scfm |
1,707 scfm |
1,698 scfm |
1,689 scfm |
|
Input KW |
262.3 KW |
263 kW |
264.1 kW |
265.4 kW |
|
Specific Power |
5.99 scfm/kW |
6.49 scfm/kW |
6.42 scfm/kW |
6.36 scfm/kW |
|
Turndown |
35.8% |
51.2% |
48.9% |
46.4% |
ME = nominal .95
Table 1 Notes: From 125 psig discharge pressure (85°F cooling water) to 100 psig discharge pressure (60°F cooling water), the flow goes from 1,572 acfm to 1,707 acfm; the shaft power goes from 334 bhp to 335 bhp (175 acfm more for 1 bhp); and turndown goes from 35.8% to 51.2%.
Lessons Learned
This document was created to identify and explain the definitions behind centrifugal performance data and its importance. With this information, the user can work with their local OEM supplier and or technical engineering groups to select and properly apply a unit to fit the specific site conditions in an optimum manner.
Hank van Ormer is the Founder of Air Power USA and a Contributing Editor for Compressed Air Best Practices® Magazine.This article was adapted from Centrifugal Training Materials provided by Air Power USA. For more information, contact Hank van Ormer at hankvanormer@aol.com or visit www.airpowerusainc.com.
Read Part 1 Centrifugal Air Compressor Basics: Performance Terms and Definitions. To read more about Air Compressor Technology, please visit www.airbestpractices.com/technology/air-compressors.