In 2021, Compressed Air Best Practices® Magazine interviewed members of the Molson Coors Canada team, at their Toronto Brewery, to gain an understanding of the work being done to improve energy efficiency. The team members interviewed were Doug Dittburner (Chief Engineer), Antonio Mayne (Utilities Optimization Engineer) and Khalil Daniel (Engineering Intern).
Good morning, can you briefly describe the Molson Coors Toronto Brewery?
Good morning. The Molson Coors Toronto brewery is the largest brewery in our Canada network and it’s one of the largest breweries in Canada. We produce 40 brands of beer packaged in a few different sizes of cans, bottles, and kegs. We perform the full brewing process from receiving raw materials, brewing and then packaging finished goods. This facility brews 3.3 million hectoliters of beer per year - the equivalent of 980 million 12 oz. cans.
What energy efficiency goals exists at Molson Coors and what are your roles in achieving them?
Molson Coors launched a project in 2016 to analyze our enterprise carbon and energy footprint. We conducted an audit of our operations to help us identify our key sources of emissions and opportunities to reduce our impacts. By 2025, we aim to reduce absolute carbon emissions from our direct operations by 50%, and achieve an absolute carbon emissions reduction of 20% across our supply chain. To support this goal, we are investing in renewable energy solutions and performance tracking technology to support great accountability and visibility in our operations.
Our energy mix here at our Toronto brewery is electrical at 30% of total energy consumption and fuel making up the 70% balance. Refrigeration chillers for a central ammonia system are the largest electrical energy consumer, followed by compressed air and then motors and drives. Natural gas is by far our largest fuel source. Our team acts as a technical resource on all topics utility-related; electricity, fuel, water and secondary utilities like compressed air, refrigeration and steam. We support the powerhouse, maintenance and production teams.
In Ontario, we have a 97% carbon-free electrical grid as our energy sources are hydro and nuclear. In order for our site to reduce carbon emissions, the focus is on fuel. We have many projects focusing on this. Electricity, however, is rather expensive in the province at an average price of \$0.10 USD per kWh. We believe only California has a higher average cost for electricity in North America.

Chief Engineer Doug Dittburner “marshalls” a compressed air leak program engaging production and maintenance staff!
What key performance indicators are your monitoring to measure energy performance?
Our energy intensity measure in Canada (energy use normalized for production) is kWh per hectoliter (100 liters). In the U.S., they use kWh per barrel (117 liters). I (Antonio) started in this role in 2017 and since then our total (fuel and electricity) energy intensity, at this brewery, has dropped by 20% as of late 2020. We expect it to drop by 30% by the end of 2021 and forecast electrical energy intensity use to drop by 20% during the same time period.
This reflects the corporate decision to prioritize reducing the impact of our operations and to prioritize visibility and accountability. There’s been a lot of support within the brewery and from the corporate network.
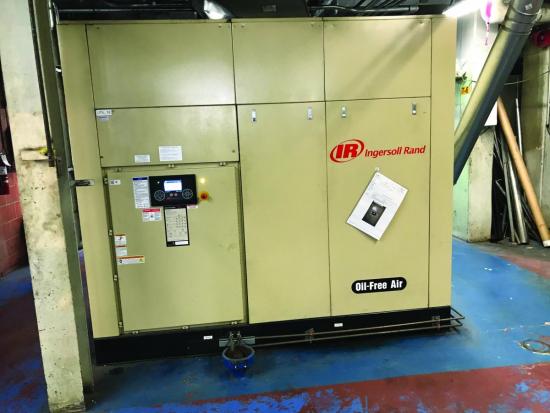
An oil-free rotary screw air compressor at the Molson Coors Toronto Brewery.
What kind of compressed air measurement and monitoring is done?
Compressed air was identified years ago as an energy-intensive utility and we have focused resources to optimize it’s use. We have four oil-free rotary screw air compressors and run two at a time. Their energy consumption is monitored. The compressed air dryers provide a a -40˚F (-40˚C) pressure dew point which is monitored to ensure air quality.
We also monitor compressed air pressure. We monitor it at the main header and at a few other points downstream where we can pull data. Our average pressure at the header is 105 psig. We also have local pressure gauges to make sure we have enough pressure.
Compressed air flow is monitored to measure our demand for compressed air. We have divided up the entire plant into four sections to be monitored. The sections are the brewing area and the three major areas of production (cans, bottles, kegs). Most of the compressed air flow meters we use are pitot-tube flow meters. They don’t have pinpoint accuracy but what we are looking for is changes in trends to identify problems or validate improvements.
We distribute reports to each major department showing their use of compressed air along with targets for use-reductions for each department. Right now, the targets focus on base load reductions of compressed air use – particularly compressed air leaks.
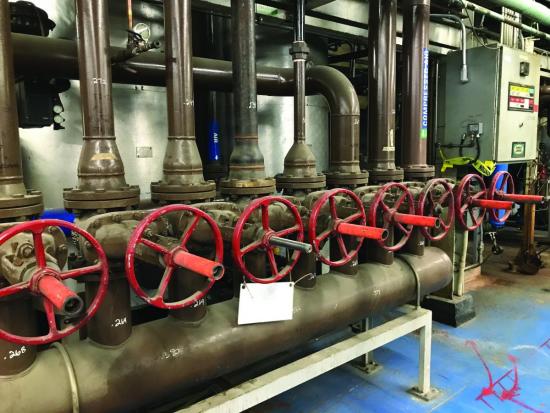
Compressed air average pressure, flow and dew point is measured and monitored.
How do you go about reducing the level of compressed air leaks?
We monitor compressed air use in the four sections of the plant at the department level and monitor some individual pieces of equipment. In the brewing area, for example, we have a pneumatic conveying transport system to remove the remaining husks after we use the malt. This system uses blowers with compressed air as the back-up. We monitor this unit to make sure only the blower air (less than 15 psig) rather than our 105 psig compressed air is being used.
Doug is really good at engaging staff in our compressed air leak program. We have free lunches for both finding and fixing a leak. He made tags available for all production and maintenance personnel. When you find a leak you tag it and submit a copy to a raffle box. If you fix a leak your ballot stays in the raffle box permanently. Sooner or later your name will be drawn and the participation is awesome.
Antonio previously worked in maintenance roles - in both the packaging and brewing areas of the brewery. That experience helped tremendously by providing familiarity with the actual operation of most aspects of the brewery. He’s worked closely with most of the staff and management and is not an outsider asking for changes. Having this trust already established makes it clear he is providing support to the maintenance team-not looking for problems.
We are entering all our compressed air leaks into our general maintenance system so they are all tracked. We’ll have an identifier in one of the fields and we can see how we are doing, if parts on order and if they scheduled to be fixed. Leaks are in the backlog of maintenance items just the same as fixing a motor. If leaks are on a separate spreadsheet, it can get lost.
One way we find leaks is by scheduling someone to look for leaks during planned stops on the production line, when we take it down for 10-15 minutes. Operators and maintenance use these planned stops to clean and inspect the productions lines and they are an opportunity to find compressed air leaks. We also perform dedicated leak inspections. We bought an ultrasonic imaging leak detector - you can see the air leak and it’s pretty neat. The image is very clear and makes it easier to find in a noisy environment.
We’ve been doing compressed air leak detection for a few years now. Since we started, we’ve seen a 20 to 30% reduction in weekend usage of compressed air - which is how we calculate our leak load. We are pretty much idle on weekends and this allows us to make this measurement.

Dino DeFilippis, from Airnergy Management Services, monitors air compressor energy consumption.
How else have you reduced unnecessary use of compressed air?
We have optimized shutdown procedures and shut down equipment which doesn’t need to be on. We also use valves to kill compressed air supply to an entire area, over the weekend, when this area is idle. This way there will be no leaks over the weekend.
Some of our case packers have solenoid valves which can be closed. We like that way better because it’s easier for maintenance to turn them open them back up. For operators, we give it to them to do in respective areas. Doug’s power engineering team will do valving on a header.
Thank you for sharing Best Practices at Molson Coors.
For more information about Sustainability at Molson Coors visit https://www.molsoncoors.com/sustainability/sustainability-reporting.
To read similar Food & Beverage Industry articles visit www.airbestpractices.com/industries/food or https://coolingbestpractices.com/industries/beverage.