A meat processor, located in Canada, hired a consultant to assess their compressed air system as part of a company-wide energy conservation effort. The assessment and analysis showed, despite having a modern compressed air system using a VSD air compressor and pressure/flow control, the system was running inefficiently and had significant levels of leakage and inappropriate use.
Initial Findings
The facility has installed a compressed air system consisting of three air cooled lubricated screw compressors, one being a 200 hp variable speed drive compressor (VSD). The fixed speed units are 150 hp and 100 hp. These compressors are locally controlled in each compressor. The system has a mist eliminator filter installed before the air dryer. A single heated blower type desiccant dryer with dew point control (EMS), with coalescing filtration on the inlet and particulate filter on the outlet, has been installed to produce dry compressed air for plant operations. The compressed air is directed throughout the plant by a system of galvanized steel piping. Two large storage receivers are located in the compressor room area as system control storage, and two are in the plant at the end of the pipeline for pressure stability. An electronic flow control valve has been installed to regulate the plant pressure, however, it was out of service due to failure.
The compressed air is delivered to the multiple production areas through a main 3-inch galvanized piping header, where various branches are tapped to supply each production area. The piping is arranged in a loop for the main production areas. Installed data loggers showed minimal pressure loss across the piping system. Most of the system pressure loss is across the drying and filtering system.
Compressed Air System Baseline
The compressed air system electrical consumption was monitored using amp loggers. Kilowatt readings were done for both the active compressors to calibrate amps to power. System flow was recorded by placing loggers on a newly installed main flow meter at the output of the compressor room main receiver. Pressure loggers were located at the compressor discharge, after the mist eliminator and the dryer in the compressor room. Mainline pressure loggers were place at the end of line in various areas. The following baseline was determined over a two-week period:
Baseline
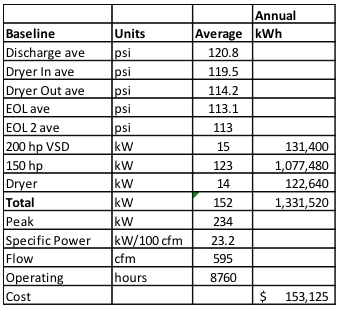
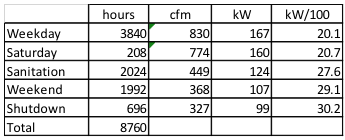
Part of the measurement period was done during a one-week shutdown, providing a good indication of non-productive flow and power consumption. A full eight days of production were captured and have been used to create the following load profile:
Shift Profile
Based on a blended rate of \$0.115 per kWh this would make the annual electrical cost of compressed air about \$153,000 plus taxes.
The readings and observations during the measurement period showed the compressed air system was producing air at lower efficiency (23.2 Kw/100 cfm), compared to similar optimized systems (optimum is under 19 Kw/100 cfm). There is significant waste due to poor compressor control, higher pressure than needed, inappropriate uses, as well as leakage and drainage. The study found significant improvements are possible. As can be seen in the previous table, the poor compressor control strategy is causing very inefficient operation during non-production hours.
Demand Side Profile
A survey of the demand side of the system was done including leakage. A total of 71 leakage points were found (some drains and inappropriate uses included). A number of end uses potentially classed as inappropriate uses were found including air motors, cabinet venting, compressed air cooling, compressed air blowing nozzles and manual drains.
The shape of the compressed air flow demand curve can be seen on the profile shown in the Figure 1. The profile shows the typical cyclical pattern of a shift oriented production process. The highest peaks are mid-morning weekdays with low flows on weekends and during shutdown periods. The pressure profile mirrors the flow demand, with lowest plant pressures occurring at the highest peak flows. These pressures fall below the lowest acceptable pressure of 100 psi identified by plant personnel.
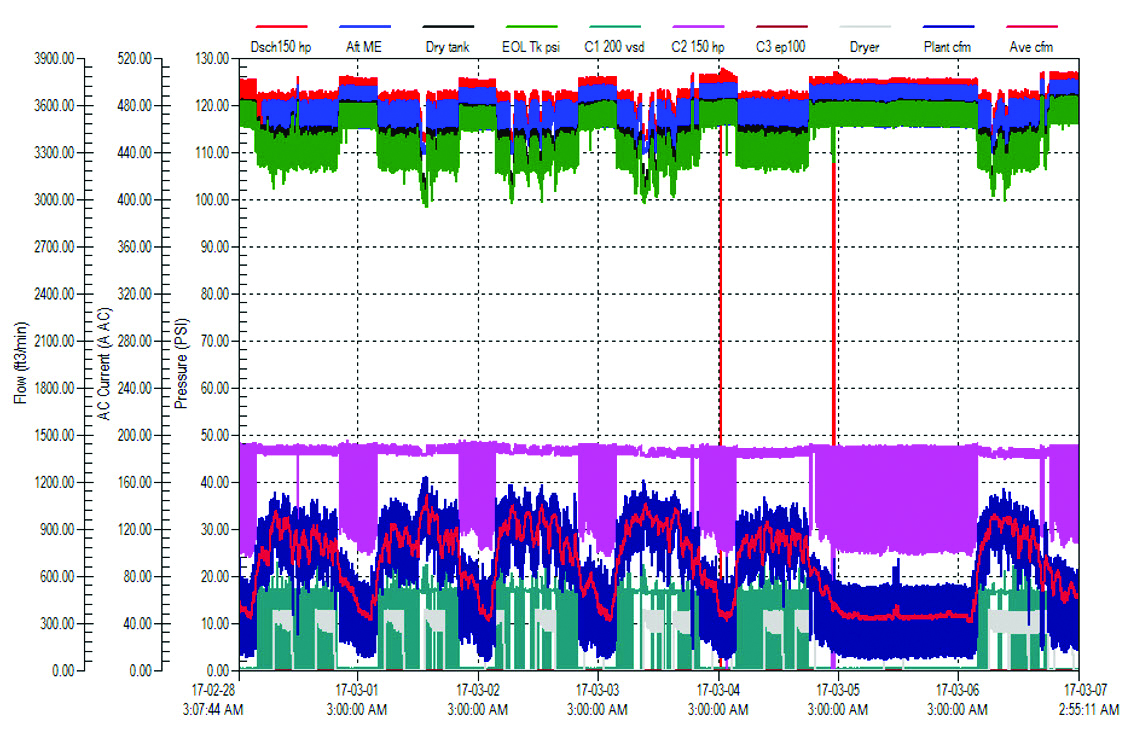
Figure 1: Compressed air profile during baseline week. Click here to enlarge.
Potential Opportunities
Analysis of the information collected shows some potential opportunities existing that could result in improvements in the operation of the compressed air system. Further, they could result in potential savings in compressed air related electrical and maintenance costs, estimated at 52% of the current costs. These savings could be worth about \$79,700 per year in annual electrical savings. There are possible additional heat recovery savings of up to about \$5,000 if the compressor heat of compression can be used to pre-heat hot water. Some specific potential opportunities are outlined in this article.
Compressor Operating Mode
One of the existing compressors was operating in load/unload mode with upper range modulation. This modulation must happen with this unit to protect the compressor motor from overload, because the compressor has been set to operate higher than its maximum full load pressure rating of 115 psi. The large VSD was operating at minimum speed, starting and stopping as required, but only during production shifts.
Modulating mode of operation is the least efficient mode for screw compressors. In modulation, a typical screw compressor will consume from 65% to 100% of its rated power through an output range of 0% to 100% of rated compressed air output. Fortunately, this unit appeared to be modulating only at the top end of its pressure settings range, the remainder of its operation was in load/unload mode. This mode is less efficient than VSD mode, especially at light loading during sanitation shift, weekends, and shut down periods.
The 200 hp VSD compressor was operating only during production shift where it runs at the bottom end of its range. This type of duty is typically not recommended, because the unit is less efficient at minimum speed, and also because it generates less heat. The reduced heat makes it difficult for the unit to drive off the moisture forming in the lubricant during the compression process. Long term operation like this can allow water build-up corroding internals, and causing lubrication failure potentially ruining the main screw element bearings.
Operating a fixed speed compressor as the lead unit and a VSD as the lag compressor is a non-standard and inefficient control strategy. This is one of the reasons the production of compressed air is so inefficient in this system. Two experiments were done to show the difference in compressor electrical consumption under two different conditions. The first is shown in Figure 3. The fixed speed unit was unloaded during a shutdown to see the effect on input amps. It can be seen under the same flow conditions the input dropped by 90 amps (the unit did not turn off because it doesn’t have auto shutdown activated, this was corrected). This equated to a reduction of about 47 kW, or almost 50%, just by better coordinating the compressor control settings.
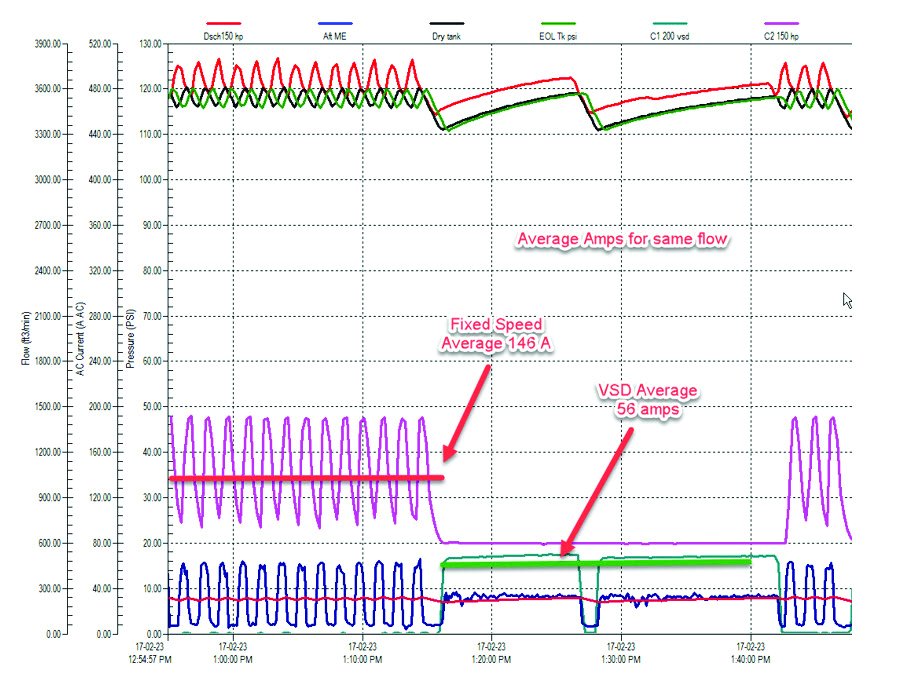
Figure 2: Control Experiment 1. Click here to enlarge.
The second experimental run is shown in Figure 4, where the compressor settings were temporarily altered allowing the VSD to run during the sanitation shift (as it should in a correctly controlled system). Again, under similar conditions, the amp consumption is much lower. In fact, the VSD made it all the way to mid-morning without needing any help from the fixed speed compressor (when the test was discontinued).
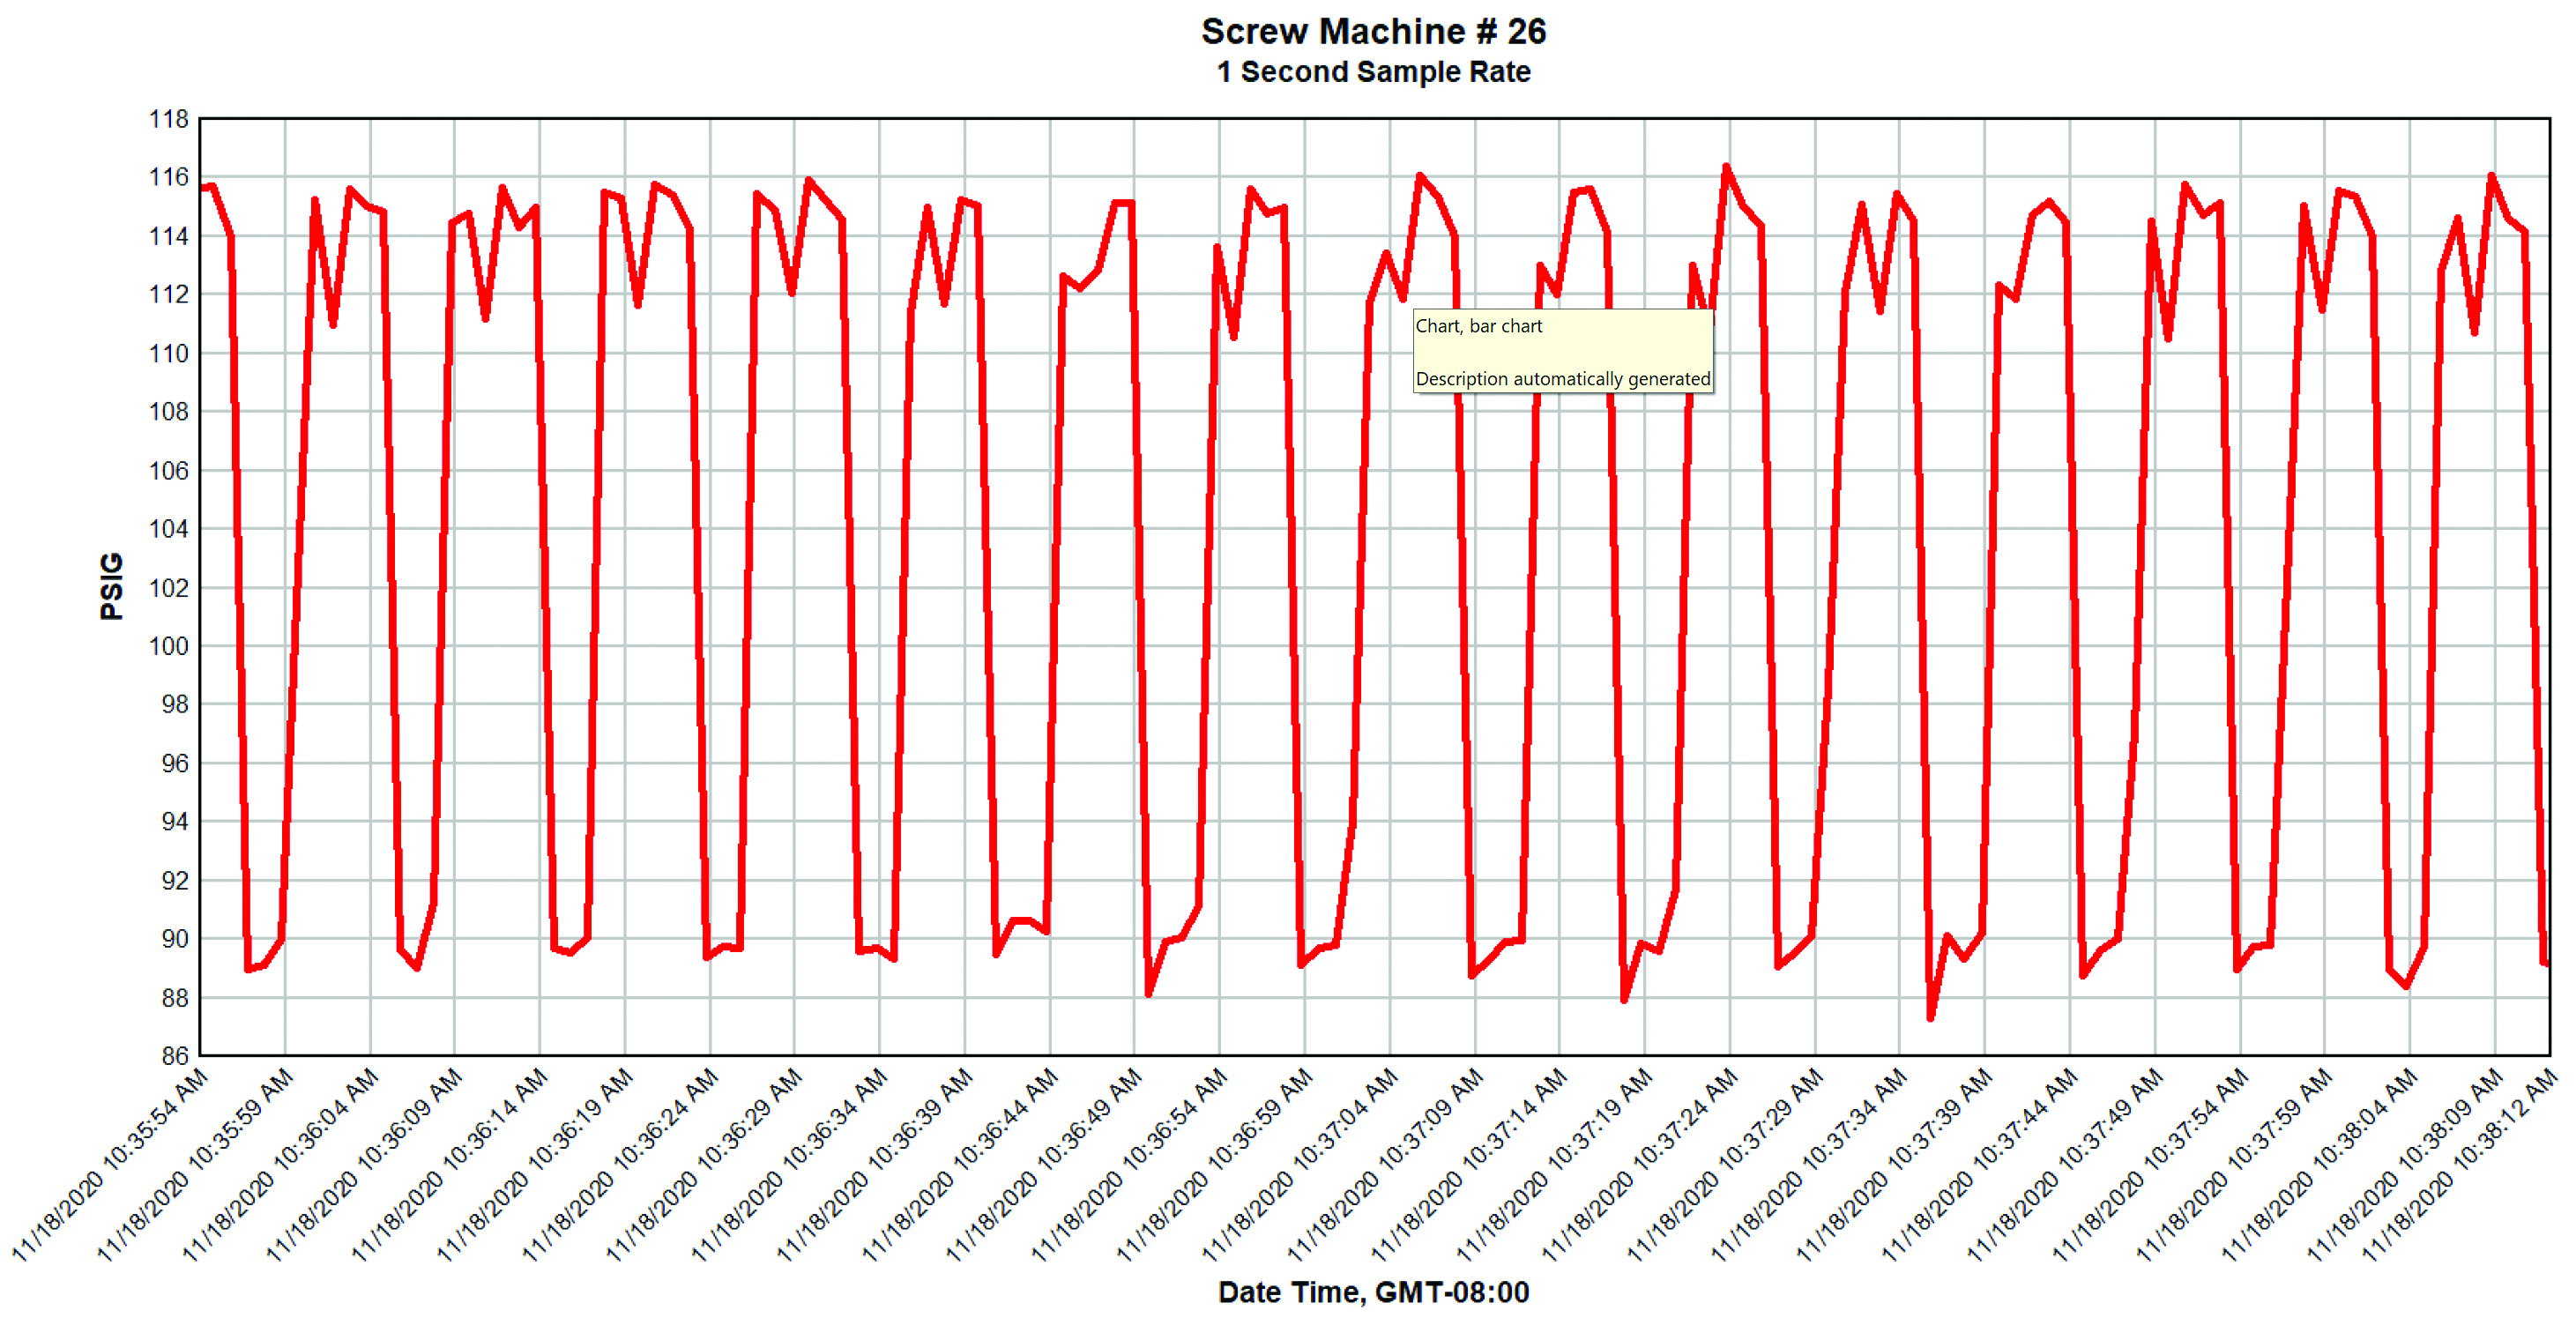
Figure 3: VSD was run for sanitation shift and showed much lower amps. Click here to enlarge.
Pressure drops can be seen on the pressure profile at peak flows. This was caused by the pressure loss across the air dryer and filters. The VSD keeps its output pressure nice and constant, yet the plant pressure drops. This dip in pressure can be corrected by implementing remote pressure sensing. With remote sensing installed on the downstream of the air dryer, the VSD compressor will hold the plant pressure at its set point, rather than allowing the discharge pressure to raise in order to compensate for the sagging pressure.
This strategy causes lower discharge pressure operation in normal and low load conditions. This saves power and adjusts the discharge pressure higher only during peaks, occurring a small percentage of the time. This strategy must be implemented carefully to ensure the fixed speed compressor does not inadvertently overpressure. A low-cost solution would be to purchase a remote sensing kit for each compressor from your service provider. However, a better way might be to purchase a compressor sequencer to automatically control all the compressors. An advantage of the sequencer would be the capability of remotely monitoring the compressor efficiency by remote web interface.
Estimated savings in energy consumption for correcting the compressor control is 334,200 kWh (6 kW peak), worth \$38,000 in electrical cost reductions.
Flow Control Valve
A pressure/flow control valve (PFC) had been previously installed to limit the line pressure fluctuations and to lower plant pressures. The lower system pressure maintained by a flow control valve will often lower energy consumption by reducing the artificial demand caused by applying higher than required plant pressures to unregulated uses. This valve will be of little benefit if the majority of the plant loads are regulated. Its presence requires the compressor discharge pressure to be higher than a normal set point, consuming more energy.
Another disadvantage of installing PFC valves is they reduce the effectiveness of any downstream storage in helping with compressor control. These are trade-offs to be considered based on the characteristics of each plant.
Testing was done during the shutdown, showing the low-level leakage load has very little sensitivity to pressure reduction. The end use survey showed most production machine load is regulated. The conclusion is, the use of a PFC for this plant will have only a small benefit.
The existing PFC has been bypassed due to malfunction. The unit has likely been damaged by very high temperatures being released into the system by a dryer problem (more on this later). It is also located in a very poor location for service and adjustment. Due to the location, when the valve fails the staff must obtain a scissor lift to bypass, causing long production outages.
Estimated savings for this measure (reducing the discharge pressure with remote pressure sensing) would be 21,400 kWh (2.3 kW peak), worth \$2,450 in annual electrical costs.
Leaks and Abandoned Uses
Air leakage and flow from unused air consuming equipment (abandoned uses) in a facility is usually significant unless there is a regular system of monitoring, leak detection and repair.
Leakage testing was done using an ultrasonic detector. A total of 69 significant leaks, or wasteful items like open drains, were found at an estimated waste of about 120 cfm. About half of this flow is within the compressor room (not measured by the flow meter). If 100 cfm of the located leaks were repaired, and the compressor control corrected, then savings of about 122,000 kWh (14 kW peak) and \$14,000 in annual cost reduction could be expected.
End Uses
End uses can often be optimized, or eliminated, for substantial savings in operating costs and improvements in air pressure. The following end uses were identified as candidates for replacement:
Cabinet Venting
This compressed air powered cabinet venting is used to prevent water infiltration into electrical panels during sanitation, and has been installed throughout the facility. This appears to be a low pressure application (regulators set to about 10 psi), air pressure about 2 psi and below by the time it reaches the panels. It is very wasteful to use compressed air generated at 125 psi for such low-pressure requirements.
Further to this, many leaks were detected on the compressed air lines placed for the venting of these cabinets due to physical damage or failure of components (see leak list). Flow tests were done on some of these venting systems, and flows of between 2 cfm and 8.9 cfm were found.
Figure 4: Numerous compressed air connections have been added to electrical panels.
Estimated average flow is 3 cfm per venting system, with the number of venting systems estimated at 12. This would consume about 36 cfm of high pressure compressed air. This flow is only really required during sanitation shifts, representing about 23% of the total current operating time.
For this application only a slight positive is required. During sanitation duty, a low pressure compressed air source, such as an aquarium pump or blower system, should be considered. Estimated savings were 52,600 kWh (6 kW peak), worth \$6,100 per year in reduced electrical costs. These savings would be offset by the electricity consumed by whatever ventilation method used.
Blowing
About 12 open blowing locations were found in the plant. The use of uncontrolled compressed air blowers is very energy intensive. If compressed air blowers must be used, then electronic control of each unit should be implemented, so the blow only happens where the product is in proximity. This can significantly reduce air consumption.
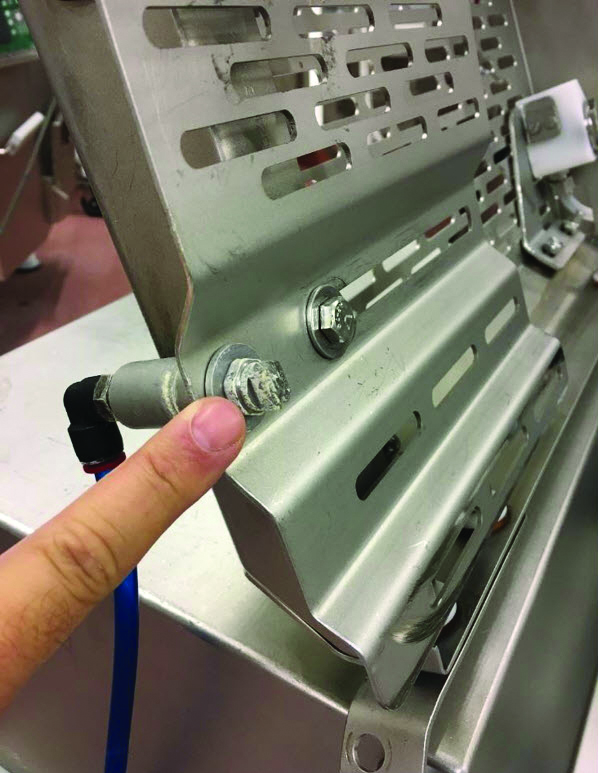
Figure 5: Example of blow nozzles.
Observation of the blowing showed some of the blowers are not effective in removing the water from the packaging, and therefore, are a waste of energy.
It appears the blowers are turned off when there is no production, this is good practice. It is estimated about 32 cfm of blowing is on during production (not all blowers operate), about 45% of the time. Reducing blow load would save an estimated 14 cfm of compressed air, worth 16,400 kWh (1.9 kW peak) and \$2,350 per year in electrical costs.
Air Motors
A number of air motors drive conveyor belts in the plant. Air motors consume about 10 times the equivalent hp than a direct drive motor, and what’s worse they consume the most air when they are unloaded.
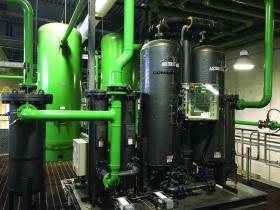
Figure 6: This air motor drives a short conveyor.
Estimated air motor flow during production is 32 cfm (each motor consumes 18 cfm). Estimated average air motor flow over full system hours is 14 cfm. Estimated savings would be 16,000 kWh and \$2,450 per year. Conversion to electric drive would consume an estimated \$200 in electrical energy to offset some of these savings.
Coolers
A flow of compressed air is being directed onto the access door handles in a meat smoker (a hot area). Due to the cost of compressed air, this is a less than optimum way to provide protection against heat. You may want to consider providing insulation on the handles.
Measured air flow was 4 cfm for each cooler, this application continues to run even during shutdown. If this was eliminated, it would reduce energy consumption by 6,000 kWh (0.7 kW peak), worth \$700 per year in savings.
Air Dryer
The existing air dryer is a heated blower desiccant style, rated at 1,500 cfm. This dryer was malfunctioning during the measurement period and purging excessively, causing it to run the heater and blower more than necessary during the production shift. The unit was regenerating 42% of the time, where with the dry winter moisture, loading the unit should have been regenerating less than 20% of the time.
Due to the malfunction, the unit was putting out compressed air at temperatures measured as high as 286°F (141°C). Compressed air hitting the flow control valve was about 158°F (70°C), a possible cause of the valve failure. This temperature may have also damaged the flow meter.
The compressor service company was called by the operators, and the dryer was discovered in the wrong operating mode (blower cooling mode). The unit was switched, so it operates with compressed air cooling, reducing the outlet temperature significantly. The problem with the dew point control should be investigated, perhaps the measurement probe needs changing (a maintenance item). It could have been damaged by the high temperatures.
Reduction in dryer regeneration power, if the control is repaired, will save an estimated 83,000 kWh (9.5 kW peak) per year, worth about \$9,600 per year in reduced electrical costs.
Filters
Pressure loss across the air dryer and filters was seen at 9 psi at only 1,000 cfm. This indicates excessive pressure drop (should be about 6 psi at full flow of 1,500 cfm). Normally, the main inlet coalescing compressed air filter and particulate outlet filter on a desiccant dryer have a 3 psid to 10 psid pressure loss across them, throughout the life of the filter. Savings can be gained by upgrading filters to more efficient units, or installing parallel filters (doubling the capacity), as there is a 1% hp reduction for every 2 psid reduction in pressure. Dual parallel filters, if installed with isolation valves, allow the filters to be changed even during full production. Install airless drains on the filters. Estimated savings for this measure would be about 9,100 kWh (1.0 kW peak), worth about \$1,000 per year.
Condensate Drains
Both inlet and outlet dryer filter drains, and the drains on each compressor drops were passing significant air due to manual drainage. Upgrading the compressor, receiver and receiver drains to low loss airless units, rather than cracking open the manual drains, or using leaky drains (small dry tank in compressor room has leaking drain), would save energy. The drain on the spare compressor was measured at 6 cfm. Estimated savings would be 21,000 kWh (2.4 kW peak), worth \$2,500 per year if all these drains were upgraded.
Compressor Room Environment
The compressors are located in a hot room with numerous large refrigeration compressors. The inlet cooling air is very warm, causing higher than desired discharge temperatures adding extra moisture load on the air dryer, causing it to consume more energy. Every 54°F (12°C) in extra discharge temperature doubles the amount of water in the air.
The heat of compression from the compressors is being redirected into the room through air dampers with a summer/winter mode. In summer, the air is directed outdoors, in winter the 138 kW of compressor heat is directed into the compressor room. Thermal imaging showed some of this hot air was being directly sucked into the cooling air intake of the compressors. Discharge temperatures showed outlet temperature of 88°F (31°C) even on a very cold day.
Consideration should be given to operating in summer mode all year-round, in order to keep the hot air away from the intake and to help keep the compressor room as cool as possible.
Heat Recovery
Air compressors produce significant amounts of heat able to be recovered for process requirements, such as hot water pre-heat, boiler make-up pre-heat or to supplement building heat. Most compressor suppliers can provide optional heat recovery systems with their compressors for these purposes. This should be considered in this location, as the compressor heat is not currently being effectively recovered (heat is rejected into an already hot room). There will be about 600,000 kWh of heat available for recovery per year. If this is used for hot water pre-heat could displace up to 41,000 m3 of natural gas heat, worth about \$5,000 per year.
Summary
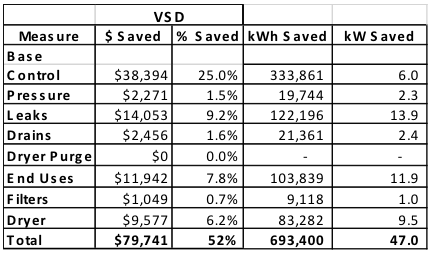
Sufficient potential exists for up to an estimated 52% savings in compressed air operating costs over the present configuration. The installation of wet receiver capacity, low loss drains, repair of dryer control, better compressor control, lower plant pressure, reduced inappropriate use and reduced leakage would save an estimated \$79,700 per year in compressed air electrical operating costs. More effective heat recovery might save an additional \$5,000 per year in natural gas costs.
A summary table of the estimated savings is as follows:
For more information contact Ron Marshall, Marshall Compressed Air Consulting, tel: 204-806-2085, email: ronm@mts.net.
To read more about System Assesments, please visit www.airbestpractices.com/system-assessments/end-uses.