To read Part 1 of this artlcle click here
The Facility
This large petrochemical facility employs 400 employees and contractors. The site covers an area of almost 900 acres. Natural gas liquids are used as a feedstock at the plant to manufacture ethylene, the world’s most widely used petrochemical. Over the past year, the company had experienced thirty (30) “close-scrapes” with having entire sections of the plant shut down to pressure losses in the instrument air system. The experience we had, during this assessment, reaffirmed our belief that every system must be approached with an open mind. There is no single, cookie-cutter, system assessment approach that works for all facilities.
This petrochemical facility was spending \$1,110,000 annually to operate their compressed air system. The blended rate for electricity at this site was \$0.03 per kWh. Electrical energy costs were \$471,000 and compressor rental/maintenance costs were \$639,000 per year. The system assessment identified yearly savings opportunity totaling \$743,000 per year could be found with an investment of \$1.15 million. The simple ROI on the project is 19 months.
This system assessment exhaustively examined the supply and demand-sides of the compressed air system. Part 1 of this article detailed the improvements made to the supply-side. Part 2 of this article covers the demand-side projects. Due to article length space constraints, we can only describe in detail a few of the projects.
Cost reduction of compressed air systems can be counterintuitive. In this particular audit, the value of an open mind is demonstrated as this system was one where replacing compressed air with nitrogen actually makes economic sense.
Demand-Side System Overview
The purpose of the audit is to improve reliability throughout the facility. Reliability on the demand side can be defined by having adequate air pressure and air quality at all times throughout the facility. This outcome is a function of both the operation of the supply side in the operation of the demand side. If a demand problem occurs, such as a dust collector pulsejet failure, it can reduce the air pressure in a local sector. If a compressor fails, any backup compressor takes too long to start, the pressure would drop in this circumstance too.
Actions that can be taken in demand to improve system reliability primarily fall along the lines of reductions in demand. Reductions in demand affect the system in three different areas: demand, distribution, and supply.
By reducing demand, there are fewer competitors for air in a particular sector. An upset in one location will have less of an impact on the other applications in the area. Any extra flow that might be required for that upset, would therefore be more easily met by both the supply and distribution system.
A reduction in demand also has an impact on the distribution system. The lower air consumption means that the piping system has less demand to carry, reducing the pressure drop between the compressor room and the applications. This lower pressure drop means that either more air is ultimately stored in the system if the pressure is kept at the higher-level or the pressure setting to the plant can be lowered. Lowering the pressure the plant in a system with a flow controller means there's more storage in the air system to meet peak loads. Lowering the pressure in the system without a flow controller reduces the operational pressure of the compressors resulting in lower operating temperatures.
Lowering the system pressure whether flow controller is there or not, results in a lower demand overall in the majority of systems. This reduced demand reduces the duty cycle of the compressors which in most cases improves the reliability. In many cases this reduction in demand allows for fewer compressors to be online at any one time. These additional compressors are now in the backup mode and if the controls are properly configured, then they can now be set up to come online quickly in the event of a major demand events or a failure of another compressor.
Furthermore, reductions in demand ease the load on the dryers and the filters. The reduced load can improve air quality in cases where the clean up equipment is running near its full capacity. This also reduces the pressure drop across the clean up equipment.
In some cases the reduction in demand also enhances the reliability of the application itself. For example, decreasing the number of pulses for a dust collector or increasing the air quality to the dust collector ultimately results in longer bag element life.
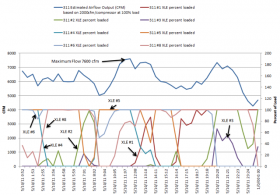
Therefore, demand reduction, is actually quite important to a reliability improvement. At the same time it helps create financial return thereby increasing the value of the project financially to the organization. As the following chart shows, we believe there is a minimum of 731 CFM of demand reduction available and could likely go even higher with an aggressive program.

Dust Collectors
Dust Collector Controls – of the 10 dust collectors observed, seven were timer-based controls and three were pulse on demand or clean on demand controls. The challenge the timer-based control systems is that they pulse regardless of whether the bag is clean or dirty, if they are not interlocked to the fan controls. Of the seven units observed, six were running despite the fact that the differential across them was zero or close to 0 inches of water column. Adding clean on demand controls and setting them to pulse between three and 5 inches or four and 5 inches of water column will significantly reduce the demand on all of these units for minimal cost. Adding clean on demand generally cost between \$600 and \$1600 per bag filter depending upon the age of the existing control system. This cost is for NEMA 1 type controls. It is not known whether the dust collector controls need to be rated for NEMA 7 duty. The project assumes that at least five dust collectors will be retrofitted with clean on-demand controls.
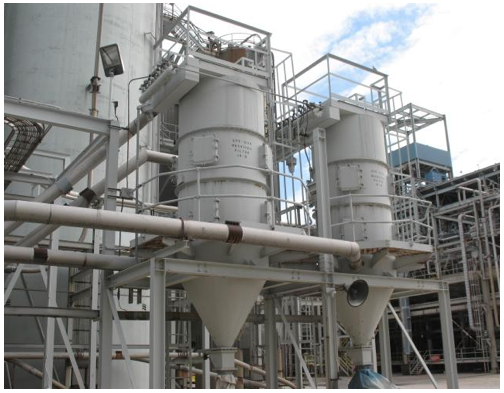
Three of the units that were equipped with clean on demand controls were effectively set up by timer based controls. These units were in the railcar loading and railcar/truck load areas. They were effectively set up as clean on demand because their cut in pressure was 0 psig and their cut out pressure was 2.5 and 4 inches of water column. An example of this is shown to the left. By setting this up to clean at 0”, the effectively made it a timer based control system negating any potential air reduction.
There is an additional benefit to operating on clean on-demand and that is bag life. The fewer pulses the bag sees, the longer the element lasts. It is very conceivable to double and triple bag life thereby increasing the reliability dust collectors as well as reducing their operational cost by adding this type of control system
There are two additional actions that the plant can undertake which will improve the operation of the dust collectors. The first action is to meter the recovery of the manifold. What that means is throttle the feed air to the manifold so that air pressure recovers to its max right before the next pulse occurs. While this does not change the actual demand (that is the number of molecules of gas used) it does however reduce the flow going to the application. Rather than supplying a single large pulse of air, this method provides a trickle charge to the dust collector minimizing its impact on its neighbors. It also has the additional benefit of limiting the amount of flow lost to a failed pulsejet.
The second action the plant should consider undertaking is the addition of a pressure gauge reading the actual pressure in the manifold that is easily accessible to an operator. If a pulsejet fails, it will suck down the entire contents of a particular manifold and possibly cause low air pressure to its local sector. If the pressure gauge is nonexistent or inaccessible, it is far less likely for local operator to note the actual pressure. The existence of this pressure gauge will allow operators going about their normal day-to-day operation to note a pulsejet failure earlier. It will also speed up the process troubleshooting low air pressure problems in the plant as the dust collectors can be scrutinized in 5 to 10 seconds rather than 30 to 60 seconds.
1. Open Blowing and Aeration
There were several areas in the plant where hoses with the straight valves and no safety nozzles were found. These were found in railcar loading, on the top assist polymer unit storage silo and the polymer unit pellet scalperator. We observed in operator using a three-quarter inch hose with a valve in the rail loadout and were told that the separator screen cleaning occurred on a very regular basis.
We believe the plant can get very acceptable results in all these applications with minimal effort and cost.
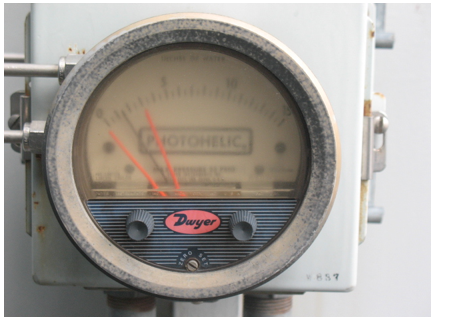
In the case of the rail loadout, the plant and attempted to use the Silvent 707 C nozzle. Operators no longer use the nozzle and this is likely because it did a poor job. The specifications for this nozzle are shown in the attachments section. An analysis of the nozzle shows a potential explanation for the problem. The graph to the right was created using the data from that table. It shows the velocity of the air as a function of distance from the nozzle tip and it is easy to see a very quick drop-off. The particular gun that we saw did not have an extension on it and would look close this to the gun on the far left below.

This would mean that the operator would hold it in his hand and the distance between the nozzle and the plastic being blown could be 5 to 10 feet and possibly more.
We believe that if an extension were added to the gun, the velocity would be higher where it counts most at the plastic bead. It is also likely that a nozzle that uses less air could be used as long as it had an extension. If you've ever worked with even small safety guns, your experience would probably tell you that even these guns if the air was applied closer to the beads, the blowing force would be more than sufficient to clean the top of the railcar.
In the case of the pellet scalperator, we found two 3/8 inch hoses and a 1/2 inch hose, all of which were off. These hoses likely use between 50 and 200 CFM each when in operation. We had not observed the cleaning of the screen so it is not possible for us to say with any certainty whether or not blower air could do the job.
It is recommended that the plant test multiple blowguns with extensions for rail loadout and separator cleaning. Involving the end-users with the testing program increases the likelihood of success. Suppliers that could be included are Guardair, Silvent, Exair, Wondergun and/or ITW/Vortec. The purpose of the testing would be to find the nozzle or air gun with the lowest flow that cleans acceptably well. It may turn out that different nozzles are required for the different applications. The project assumes that 10 guns are purchased for use throughout the facility. While no savings are projected, the use of these engineered nozzles will meet OSHA's requirements while reducing the impact an open line can have on its immediate neighbors.
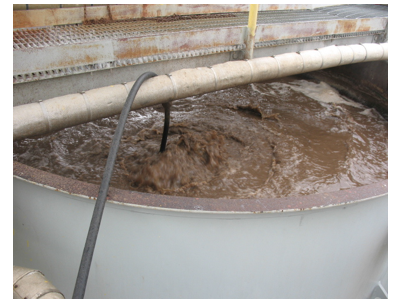
Compressed air was also used in the wastewater area for sparging of a tank. A flowmeter was installed and the demand was measured at 44 CFM. This application can be seen to the right. Discussions with the plant indicate that it is probable that air from the Lamson blower could be used as an alternate. Blower air typically costs 1/3 to 1/10 of the cost of compressed air and hence replacement would have a positive effect on the overall cost of operation. It would also take a significant demand off the pipe feeding the wastewater area.
Please note that the single biggest error plants make when installing blower air, is under sizing the feed pipe. If blower air is to be used, the piping needs to be sized for the flow and will likely be in the 1.5 – 2” size.
Leaks
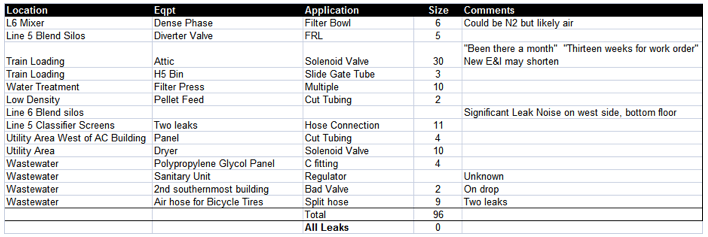
At the time of the write up of the demand side, the full leak study had not been completed. It is inevitable that during the course of an audit, leaks are found. While this survey is far from exhaustive, it is a start as it will often catch a substantial portion of the larger leaks in a facility. An additional ultrasonic leak study is being conducted and that work has not been completed as of the writing of this report. Therefore, the potential savings projected in this report is likely to be lower than the actual projections from the leak study. In general, the leak load is fairly low of what we see in most plants of this size. The table below shows what was found
 |
|
 |
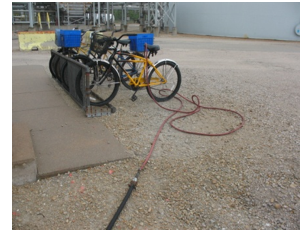
One leak that was found illustrates the need for operator awareness and training. This was on a hose used for tire filling in the wastewater area. This can be seen to the right.
This black hose had to air leaks consuming roughly 10 to 15 CFM and would cost the plant \$1800 year-round.
Rather than turn the air off to the hose or repair the hose or replace the hose it was just left on. This makes perfect sense if there is not an awareness that compressed air costs as much is a really does. We saw multiple occasions of conscientious behavior and would think that compressed air would be no different if the operators had a clear and precise understanding of the cost of compressed air. We suspect that if the operators realized that this hose leak was worth \$1800 per year, they would do something about it. Therefore operator training is recommended on an annual basis.
Reducing demand is a key component and a critical strategy in the overall plan to improve reliability. In sustaining these improvements, leak detection and repair needs to be an ongoing activity for the facility. Please note that both the detection and repair need to be done on a timely basis.
From a detection perspective, the plant should have an ultrasonic survey done once every six months. The survey, leaks are identified, tagged and quantified in scfm. Wherever possible, the cost to repair the leaks should also be documented too. Without this information, the plant is not able to make a sound business decision whether to fix a leak or not.
Detecting where the leaks are with the human ear while the plant is in production is very difficult. Ultrasonic detection devices exist that would allow an operator to listen for leaks by tuning in to a specific frequency that is unique to compressed air, and makes detection much easier during production. These devices are expensive, especially when intrinsically safe, but they are valuable.
Leak repair also needs to be done on a timely basis and it sounds as if this is the primary challenge facing this facility when it comes to a sound program. In talking to the operators at rail loading, we discovered that a repair work order had been in for four weeks. We were then told that it takes roughly 14 weeks for the repair. The cost of this leak is roughly \$450 per month and would only cost \$200 to \$300 to fix. So the plant wastes \$1600 of air for a \$200 fix.
What may make sense is to develop a program where the leaks can be categorized as small, medium, and large, and have maintenance evaluate any medium to large leaks found by production personnel. They could then assess the cost of repairing the leak versus the costs of the leak. This would then allow them to make a decision as to how quickly the leak should be repaired and if internal resources were not available, then outsource the repair.
It is assumed that 100 scfm of leaks can be eliminated and kept off line.
Compressed Air Replacement by Nitrogen
In most plants, auditors often look to replace nitrogen with compressed air. The cost of nitrogen is usually much greater than compressed air. This plant is in a unique situation where the nitrogen demand has dropped off enough that the nitrogen plant is blowing off excess nitrogen. It's been estimated that there is 1300 CFM of blowoff which ultimately could be used to replace of compressed.
This turns common sense on its head and suggests there is an opportunity to reduce cost by reducing the air consumption using nitrogen as the replacement gas.
There are great many applications where the air could easily be replaced by nitrogen. There is obvious concern with applications involving human respiration in the immediate area. In the evaluation of applications, consideration should be given to the actual CFM used by the process any area does in as there may be some applications such as outdoor panel purge where the concern may not be that large. For instance, our best estimate at the moment for panel purge is a few CFM. We would be surprised if a panel located in an outdoor location can have enough CFM flow to asphyxiate a worker on it given the open conditions. We would involve the safety director in making this determination.
Other applications that would seem to be likely candidates include instruments such as the fire eyes peepers and irises, valves, and possibly the cabinet coolers. More information is required to determine if the decokers would be a viable candidate, but if it was, then the replacement of compressed air with nitrogen could have a significant impact on the overall operation of the ethylene side of the plant.
While the audit currently assumes only 100 CFM of replacement, there is 1300 ft.³ per minute of nitrogen potentially available which could have a massive impact on system reliability.
Over the long haul, it does make sense to measure nitrogen blowoff if it is not being done at this point in time. It is possible that the nitrogen applications would need to be shifted back to air the the process requirements for nitrogen increase.
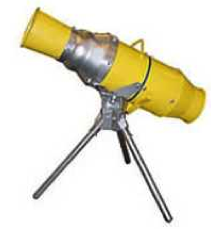
Air Movers
Air movers are a flexible, light (as in weight) source which are easy to move and position in response to a need for cooling. This convenience comes at a cost.
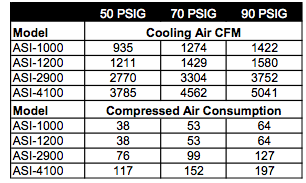
For example, look at the performance of one manufacturer’s air mover, the ASI-1200. Looking at the performance at 70 psig, you’ll see that the fan produces 1429 scfm of cooling air consuming 53 scfm of air. That is roughly the equivalent of 12 hp at 4.5 scfm per hp.
Electric motor driven fans, while a bit bulkier are far more efficient and can provide far more cooling air flow for less power. One brand’s 1 HP vane axial fan with 10’ of duct produces 2940 cfm of cooling air.
Four air movers were observed throughout the facility. The first unit observed was a Coppus RF 20 was on top of a polymer unit blender roof and was used for silo venting. This model consumes 160 CFM when in operation.
 The second was a Texas pneumatic unit and is likely the model TX6. This was being used in the low-density area for work being performed on one of the hyper compressor motors. This also was an explosion-proof area the expected demand is roughly 60 CFM.
The third unit was a Jectair model eight and was in the air compressor room and was used strictly in the summer on a compressor oil cooler to provide additional external cooling. Its nickname is the Arkansas cooler. This unit at 60 PSI would consume 178 CFM. If in operation for three months of the year straight, then the annual cost is \$7900 per year and it would be consuming air only when the compressors are taxed the most due to the lower density that occurs in the summer months.
A fourth unit was found on a furnace deck and this particular unit consumes 132 CFM when in operation.
One consideration in replacing air movers at this facility is the local environment where the air mover is being installed. One of the challenges in applying these air movers is where and how the fan motor is connected into the facility’s electrical grid. We think this could be a permitting problem for many of the explosion-proof areas.
The project assumes that the only air mover that can be changed out easily is the cooler serving the air compressor room. Assuming that this still needs to be an explosion-proof application that is permanently installed, then a replacement air mover would cost under \$4000.
From a budgetary perspective, a 2000 CFM explosion-proof air mover would cost roughly \$2200 and consume 0.75 hp. A 3,000 CFM explosion-proof air mover would consume 1 hp and costs roughly \$3300. A 5000 CFM air mover costs \$3800.
Replacing the other pneumatic air movers can be replaced with electric motor driven units is treated as an option.
Conclusion
Keeping an open mind is critical in all system assessments. Each client has different priorities and circumstances. In this case, the plant had a significant volume of compressed air that could be eliminated without negatively impacting plant productivity. In taking the approach of detailed demand side analysis, the potential for system improvement in terms of reliability and operational cost was increased substantially. By taking an even wider viewpoint and considering the counterintuitive, additional opportunities such as compressed air replacement by nitrogen, were added to the potential list of actions to be taken.
Contact Paul Edwards; tel: 704-376-2600, email: paul.edwards@loweraircost.com, www.loweraircost.com
To read more System Assessment articles, please click here.