Introduction
Over the years, the word has spread to management that compressed air is expensive. Management of compressed air may provide rewarding payback opportunities. Unfortunately, there is no one size fits all solution.
Most of us understand each individual has a unique DNA combination. Compressed air is very similar, each compressed air system should be uniquely designed so the system performs in harmony. Properly managing the compressed air system requires an investigative audit to understand the nuances of the system and identify the most effective solution(s) for efficiency. Not investigating the system, before selecting improvements, would be like consenting to surgery without having an exam. Yet, this frequently occurs in businesses operating compressed air systems.
Independent audits may be costly but audit expenses may be recoverable. Several utility companies provide incentives for management of compressed air. This may include the cost of the compressed air audit, in some cases 100%, if certain parameters are met.
 “Today it is entirely possible to purchase a compressor to complement
your compressed air system based on facts, not guess work.” — Jan Hoetzel, SIGA Development |
Continuous Monitoring of Constant Change
Over the years and many compressed air audits later, one thing has become clear: continuous monitoring is a key factor for efficient compressed air systems. Similarly, the only constant in a compressed air system is change. When new air applications are added, a line is down, air leaks grow or if maintenance is done to repair leaks in the system, the whole system is affected and responds accordingly. Due to the nature of compressed air systems, improvements may be quickly lost shortly after implementation and go unnoticed. System monitoring allows operators and facilities maintenance to see real time effects of changes to the system and respond with appropriate adjustments when necessary.
A continuous monitoring system is a very useful tool to understand the effect of any implemented improvement measures. Monitoring allows a step by step check to gauge the effectiveness of an improvement, taking guesswork out of the equation and giving accurate, unbiased feedback. Cost effective monitoring solutions are available for any size of compressed air system and they are easily installed. We continuously observe companies recording positive effects and resulting positive behavior changes which go hand in hand with monitoring and the resulting continuous real-time feedback of the compressed air system. Response is much quicker which results in efficiency. Efficiency translates to real dollars on your bottom line.
System Simulations Assure Sustainable Investment
Each system should be individually designed. The air compressor should not be selected from a page in a catalog without simulating the response of the compressor within the system. The best compressor for the system should be based on unbiased simulations detailing how the system will respond for the functions which need to be performed. The air compressor should complement the compressed air system and work in harmony. Today it is entirely possible to purchase a compressor to complement your compressed air system based on facts, not guess work.
Compressor system simulation software is available using the data of a monitoring system to create scenarios with a variety of types and sizes of compressors. This helps companies make informed decisions as to which set up would be the best fit for the system. A Compressed Air System Simulation provides energy and performance data. As energy accounts for about 80% of the operating cost of a compressed air system, it is the key to understanding the effect of the compressor on the overall system key performance index kW/100CFM.
Your company may be offered an expensive variable speed compressor when in actuality, it doesn’t add the value anticipated, especially for the additional costs. The specific efficiency performance may fall short of the efficiency from a proper sized load/unload compressor.
The following scenarios outline three different options/simulations and demonstrate the importance of selecting the best solution for your system, rather than trying to make the system accommodate the solution.
The compressed air data included in the graphs has been taken from an actual monitoring system and imported to the Simulation Software. System parameters have been evaluated to run the simulation. The performance data for the added compressors are taken from the CAGI data sheets which are accessible on their website. The data has been adjusted to a lower pressure demand.
|
“The only constant in a compressed air system is change, companies who manage the change find they are managing their bottom line more effectively.” — Jan Hoetzel, SIGA Development |
A Simulation Scenario
The client has two 225 kW rotary screw compressor and two 115 kW reciprocating compressors. One of the 115 kW compressors is broken and the other is strictly used as back up. The following is the one week view to address the demand profiles on weekdays and weekends.
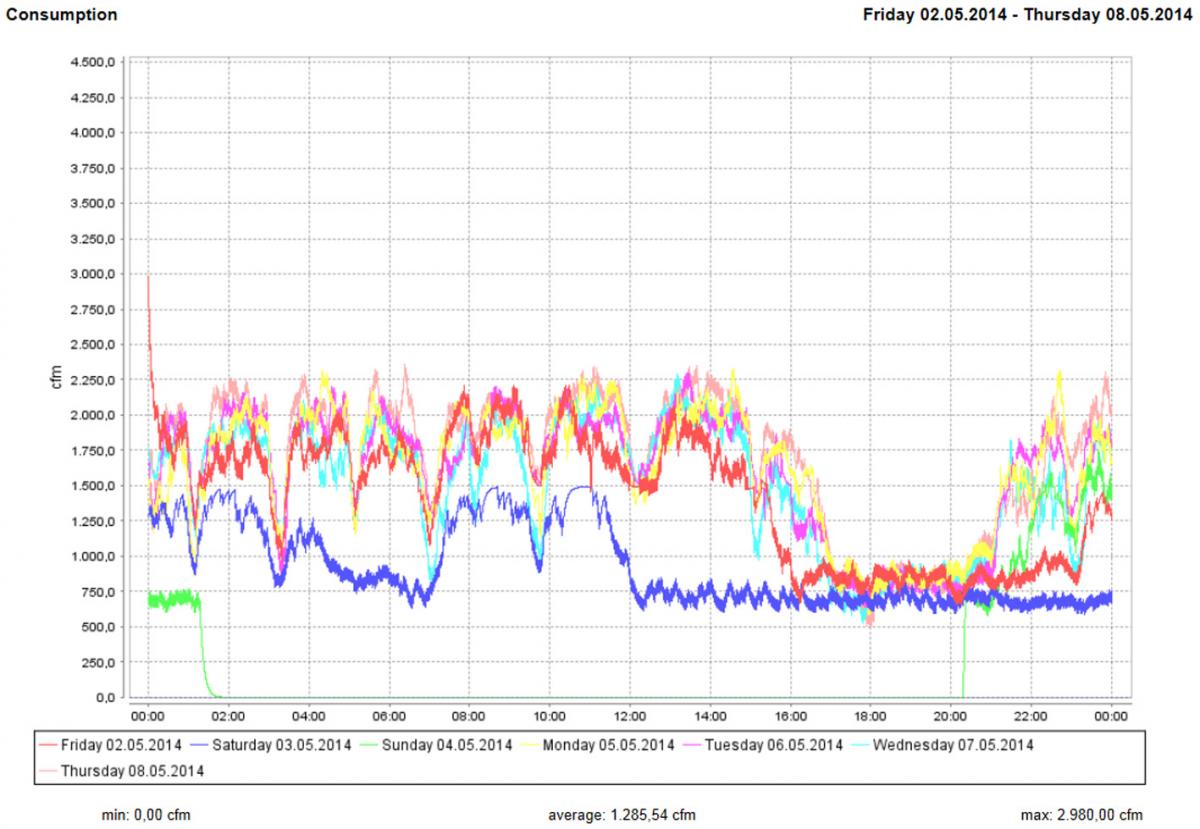
Graph 1. Seven day compressed air demand
Click here to enlarge
The demand graph shows the compressed air demand over 24 hour period. Each color represents one day. The green line represents Sunday, when the system is down from 1:20 AM to 8:20 PM. The graph provides information of the leak /min air demand rate of 750 CFM. It is worth noting the maximum demand and demand fluctuation during breaks and off shifts.
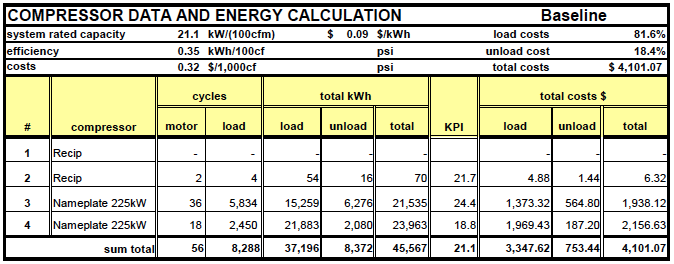
Table 1
System Optimization
The task is to automate the system, provide continuous web-based monitoring, system alerts and replace the reciprocation compressors.
The simulations allow us to peer into the future. Three options with different compressor sizes are simulated and the results of the simulations are described below. Simulations produce graphical presentations which help visualize what is happening in the system easier to see. For the sake of space, only a few graphs have been provided.
Graph 2.Seven day baseline air demand: Status quo
The compressors are fighting each other at times. The green is load and the yellow is unload.
Click here to enlarge
The compressors run on a very tight pressure range and are cycling in average every 65 seconds during the 7 days, a total of 8,288 times. The overall unload share is 18.4 %.
By simulating adding a master controller and open pressure band with the two existing 225 kW compressors, a 56% reduction of load cycles and an annualized energy savings of over 100,000 kWh results, with a system key performance index of 20.0kW/100CFM, the unload share 14.0%.
Simulating the result of adding one 140kW compressor to the two 225 kW compressor system [Option 1] results in a reduction of the unload share from 14.0% to 12.2% and the load cycles will be reduce to 3,625. The system key performance index is 19.2 kW/100CFM.
Results of simulating adding a 140 kW and a 93 kW load/unload compressor to the two 225 kW compressors [Option 2] the key performance index is 17.8 kW/100CFM. The overall load cycles with 1,627 cycles are moderate; knowing that the smallest compressor with the lowest unload kW is doing the more than 50% of the load cycling.
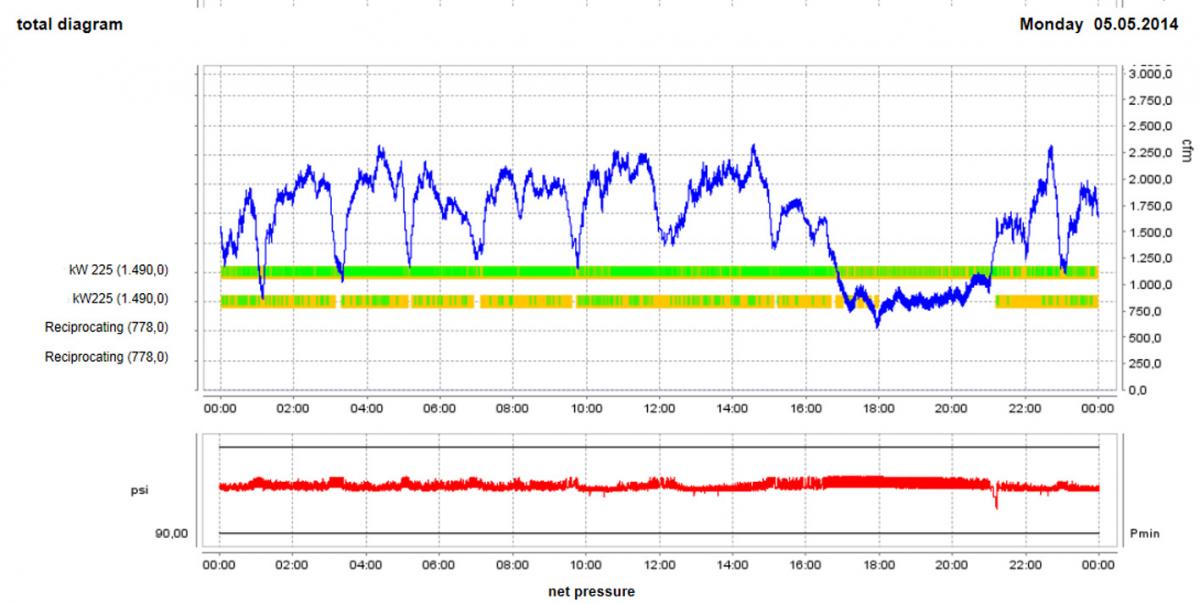
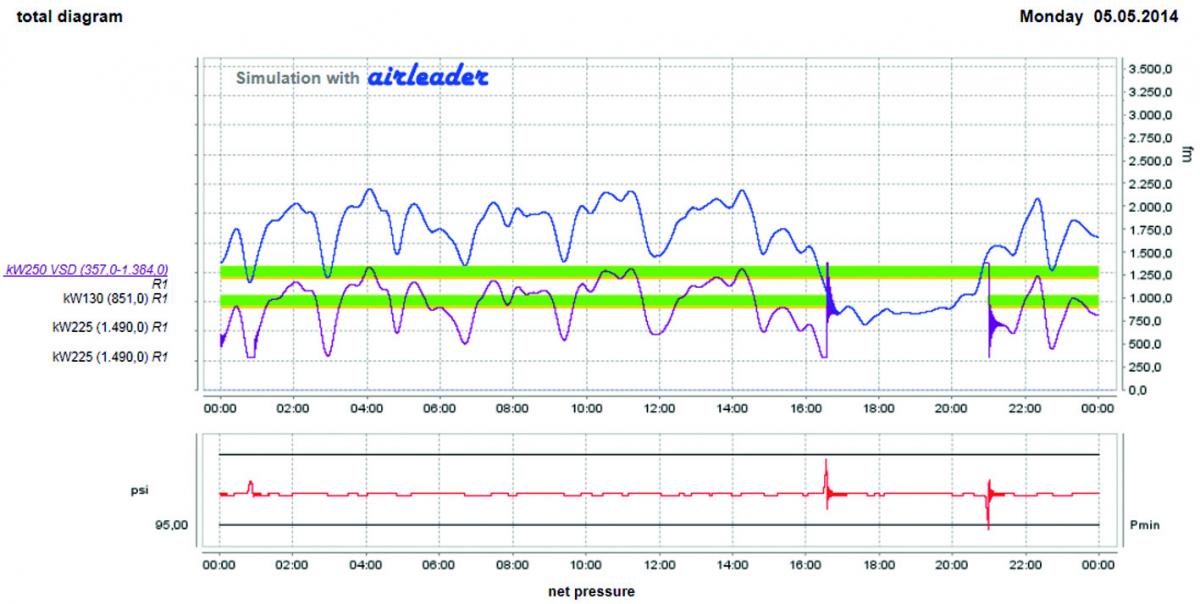
Simulation of adding a 140kW load/unload and a 185kW VSD compressor to the existing two 225 kW compressors [Option 3], the VSD compressor having a capacity of 357 to 1387 cfm and a 851 cfm load/unload compressor to the system. Load cycles and motor starts are way down, however the key performance index is at 18.0 kW/100CFM and therefore is not as favorable as [Option 2].
Visualization of trim and base-load compressor performance
Click here to enlarge
In Graph 3 the performance is visualized. The VSD is trimming the air demand continuously using the 851 CFM compressor as the base load. Only doing the off shift between 4:30 PM and 9PM the 851 CFM compressor is turned off and the VSD handles the complete load. The two existing 225 kW compressors for back-up.
Lifetime Cost Comparison
Following a simulation, a summary table provides an overview of the annualized data for the baseline, adding a master controller and three compressor options. This overview illustrates the importance of compressed air system simulation. In the current discussion, while Option 3 with the VSD Compressor shows the fewest load cycles/motor start, it is not the most energy efficient solution. Option 2 with two smaller compressors provides the most energy savings. In this case the annual savings is approximately 19,410 kW or \$1,746 at an energy rate of 9 cents above the savings of VSD solution. This results in a total savings of 364,224 kW compared to the base line.
Lifetime Cost Comparison of Simulated Option
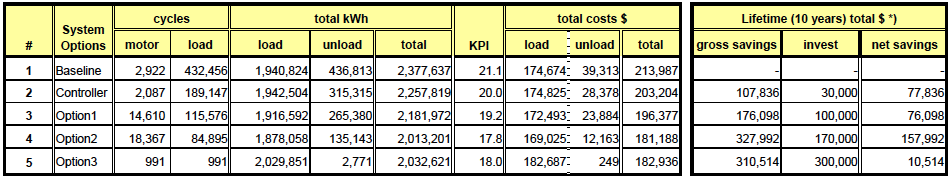
*) simple comparion, no intrest or energy cost increase is considered
Click here to enlarge
Taking into account the higher investment for the VSD compressors Option 3 becomes even less attractive. Over 10 years option2 shows a substantial saving, whereas the savings resulting from option3 are nearly used in entirety to pay for the much higher capital investment of the VSD. This statement is not a generalization. This statement is true for the evaluated system.
In times when energy efficiency is in the focus of compressed air system it is very helpful to do lifetime cost models and simulate system performances as shown above in order to make the best investment decision. Energy is the cost driver for compressed air systems and today’s simulation software allows a fact base calculation based on actual data. The days of calculating a couple of profiles (weekday peak demand, weekday off shift demand and weekend demand) belong in the history books.
As described in this example the demand swings during lunch breaks requiring a system which can response quickly and efficient to the demand changes to provide best system efficiency. System efficiency adds dollars to your bottom line.
In summary, air systems should be designed to maintain efficiency irrespective of the air demand and should incorporate design features and controls so the system can operate efficiently at any air demand. The only constant in a compressed air system is change, companies who manage the change find they are managing their bottom line more effectively.
For more information please contact Jan Hoetzel, SIGA Development, tel: 616-828-1024, www.airleader.us.
To read similar System Assessment articles, visit www.airbestpractices.com/system-assessments/compressor-controls.