Would you believe the same technology used in the launching and controlling of a space rocket is also used in your compressed air system? Yes, in some cases, “rocket science” helps to solve problems in compressed air systems and ensures the performance of the installed units. In this article, we are going to explain the technology called the “Sonic Nozzle”, that combines a space rocket thruster and your compressed air system. Additionally, we are going to walk through a case study, step by step, to show how it works.
Figure 1 – Compressed Air; it is Rocket Science
A Little Bit of History
The concept of the venturi geometry was discovered and used in the 19th century and known as the (Converging-Diverging) de Laval Nozzle. It was invented to experiment with the effect of pressure reduction through throats and to use the kinetic energy of the gas for the impulse steam turbines. However, sonic nozzles (are known also as Critical Flow Venturis-CFVs) were first used in rocket engines in the 1940s and excelled in the 1960s during space activities by NASA. The detailed studies were carried out to cover the real gas behavior and obtaining the optimal shape of the nozzle for given conditions. Besides rocket engines, today the nozzle and the calculation theory are used for measuring and limiting compressed gas flow rates accurately and repeatedly.
A Little Bit of Theory: What Makes the Sonic Nozzle so Precise?
The sonic nozzle is tailored for each application; pressure, mass flow rate and gas content. The surface roughness, roundness and the dimensions are playing a very important role in defining the flow characteristics and accuracy of a nozzle. There is a niche theory behind the topic but since it might sound too scientific, we will try to keep it as simple as possible for this article. If you are really interested in the details, we will be glad to explain further.
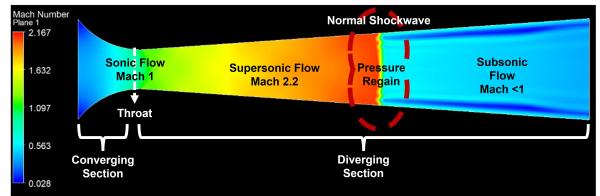
Figure 2 - Sections of the Sonic Nozzle.
The theory goes like this: Upstream of the nozzle, the gas is directed to the converging section of the nozzle to increase the velocity. Then at the throat section, where the cross-sectional area of the flow is minimum, the gas velocity reaches the speed of sound (sonic velocity, Mach 1) and now the flow is choked. The choked flow means the flow reaches its terminal rate; no further flowrate can pass through. That helps to use this device to limit the flow precisely. If the geometry and the thermophysical properties of the gas upstream are known, the flowrate can be calculated accurately. When the flow is choked, downstream pressure or piping has no effect on the flow at all. Even though the diverging section has no effect on the flow rate, it is playing an important role for having an acceptable pressure drop across the nozzle. When the flow becomes supersonic (Mach >1) in this section, the pressure regain occurs where the normal shock is observed. After the shockwave, flow returns to acceptable speeds (subsonic) and the pressure is increased further by reducing the velocity by increasing the flow cross-section. Therefore, unlike the stereotypes about sonic nozzles, it is possible to have less than 0.3 psi of pressure drop if the nozzle is well designed.
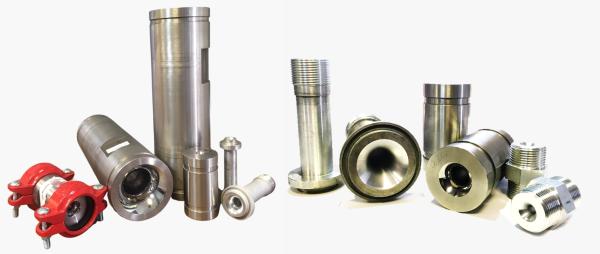
Figure 3 - Precisely Machined Sonic Nozzles
Typical Applications in Compressed Air Industry
Sonic nozzles are very popular in flow meter calibration and precision flow rate measurements, thanks to the record-breaking accuracy and repeatability. Additionally, they are used for limiting the flow, securing the operation for equipment, and flow balancing.
.jpg)
Figure 4 - Sonic Nozzle Flow Measurement Application at an Air Compressor Manufacturer QA and R&D Lab (Courtesy of Hertz).
Here are some of the typical applications of sonic nozzles in the compressed air industry:
- Compressed Air Flow Meter Calibration: As a transfer device, this can calibrate any gas flow meter precisely.
- Air Compressor and Dryer Performance Acceptance Test: CAGI’s 3rd party lab uses this technology to validate air compressor and dryer performance.
- Precise Flow Limiter for Branches Having Distribution Issues: The case study of this article covers this application.
- Precise Flow Limiter for Parallel Dryers Having Different Capacities: Due to pressure drop vs flow rate relation, the higher flow rate of compressed air tends to flow through the larger units or units having less pressure drop.
- Assures Safe Operation for Desiccant Dryer and Activated Carbon Tower: Repressurizing the compressed air system, or immediate drop in pressure, can cause a desiccant dryer or activated carbon tower to fail. This could be eliminated by a sonic nozzle placed just after the units.
- Intermittent Demand Solutions: Like jet pulse cleaning of filter bags.
As mentioned, in this article, we will be focusing on the flow distribution across the branches. We will keep the details of other topics for our next articles.
Case Study: Flow Distribution Across Parallel Dryers with Same Flow and Pressure Drop Characteristics
A large-scale cookie production plant was in trouble with a constantly faulty dryer for a long time and searching for a rugged solution. There were two 250 kW variable speed (one for back up) and three 250kW constant speed rotary screw air compressors installed in parallel to feed the main header line. By the nameplate figures, the maximum capacity was around 7000 CFM with backup. Three 2000 SCFM water cooled refrigerated dryers were installed in parallel. The simple block diagram of the compressed air supply side can be seen in Figure 5.
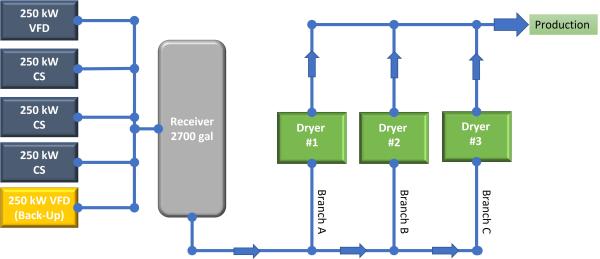
Figure 5 - Compressed Air System Block Diagram.
After installation of the flow meters and energy analyzers, it was found that the demand peak flow rate was 5000 SCFM, while the average flow rate in one shift was 3800 SCFM and during the holiday season it was averaged 1400 SCFM. The plant manager said the dryers were selected 20% oversized after an audit due to hot and humid ambient conditions while consideration was taken not for installed compressed air flow but for the actual demand of the production at that moment. The pressure of the plant was set to 100 psig, the main header pipe was selected 6” and branch pipes were 4”. The main header split into 3 branches, and 2000 SCFM refrigerated type dryers were operating at the end of them. There were many problematic points of the whole system but for this article, we will stick to our topic.
Service History
After some time passed on commissioning, Dryer #3 in Branch C failed due to overload. During servicing, it was found the refrigerant compressor tripped a couple of times and eventually the coil was burnt out. This incident occurred two more times in a row. The third time, the service engineer decided to switch Dryer #2 and Dryer #3, just to make sure if Dryer #3 had a chronic issue. Interestingly, this time Dryer #2 in branch C failed. Therefore, the problem was not the unit but the flow distribution. The customer, however, wasn’t willing to make a costly investment to correct the piping to a proper diameter and distribution.
The flow needed to be balanced for each unit. A service technician installed three valves, after the units, to limit the flow with a temporary flow meter to adjust the flows to stay in the safe zone. It was observed that for different flow rates, the distribution drifted slightly. After fine adjustment of the flows, the service technician removed the flow meters and left the plant. The plant manager thought even though this worked out quite well, it was not safe since it was adjustable, and anyone can play around and asked us to find a solution that doesn’t rely on adjustment. Plus, during low load conditions (like 1400 SCFM), the customer was asking to shut down the dryer placed in Branch A to save energy. However, switching to the normal operations will be tricky since it again might require flow meters and fine adjustment to stay in the safe zone.
Proposed Solution
Thanks to the advanced technology in Computer Aided Engineering (CAE) tools and thermofluid science, we can simulate the case and analyze it. A Computational Fluid Dynamics (CFD) tool was used for the case. CFD helped us to have a better understanding of the flow distribution across the piping and the system behavior under various conditions. Using the CFD, we were able to provide more precise solutions for this system. In our case, we have modeled the piping configuration and dryers.
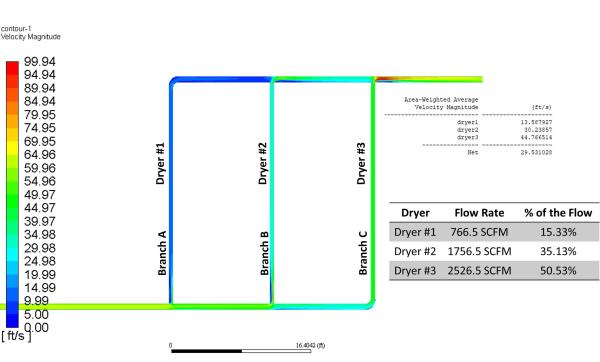
Figure 6 - Flow Distribution Across Branches. Click to enlarge.
As seen clearly in Figure 6, the flow distribution across the branches is far from being balanced. The dark blue color indicates a low velocity, so low flowrate while green to red color indicates high velocity, so higher flowrates. In this very case, while Branch A was having 15% of the total flow, Branch C was having 50% of the total flow while the total flowrate is 5000 CFM. Therefore, the dryer in Branch C is 25% overloaded to its design values. With operating condition corrections, however, it rose to 50% overloading which explains the reason for the failure in Branch C.
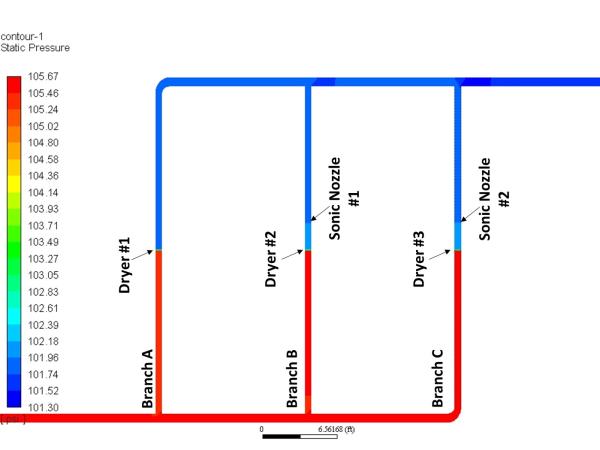
Figure 7 - Pressure Distribution After Sonic Nozzle Installation.
After consecutive simulations were carried out, the proposed solution was to install sonic nozzles in Branch B and Branch C to balance the flow. Due to the nature of the sonic nozzle operation, when excessive flow occurs, the flow will be choked and re-directed to the other branch until it reaches equilibrium. The color change in the contour represents a pressure drop in Figure 7, so the dryers and installed sonic nozzle can be recognized easily.
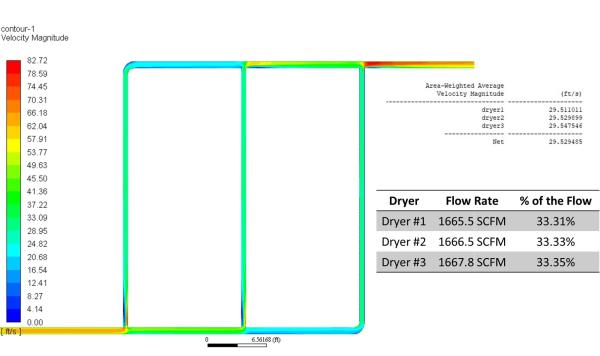
Figure 8 - Flow Distribution After Sonic Nozzle Installation. Click to enlarge.
A spectacular flow distribution was observed after the sonic nozzle installation on each branch as expected. The velocity distribution and the flow distribution can be seen in Figure 8. Even though this result looks perfect, further simulations were carried out to observe the system under various conditions, even shutting down one branch.
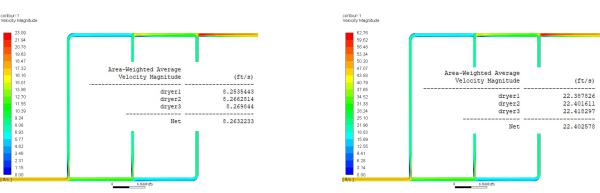
Figure 9 - Flow Distribution of 1400 SCFM and 3800 SCFM Operation Respectively. Click to enlarge.
When the flow dropped to 1400 SCFM and 3800 SCFM, the flow distribution was also equal due to the choked flow phenomenon balancing the flow across the piping. The solution was rock solid. These cases were also simulated in CFD software and results can be seen in Figure 9. In this case, if the problem was solved through orifice or valves, since it creates artificial pressure drop, it might not be possible to have equal distribution under various conditions.
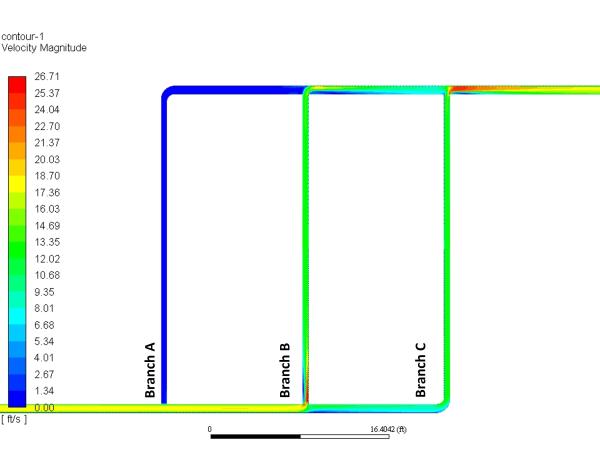
Figure 10 - Flow Distribution at 1400 SCFM While Branch A was Shut Down.
Even when the Branch A and Dryer #1 is shut due to energy concerns, the flow is distributed to Branch B and Branch C equally thanks to the nature of the nozzle again. That’s why in Figure 10, the velocity contour in Branch A was dark blue (0) and Branch B and C had similar colors (flow rates).
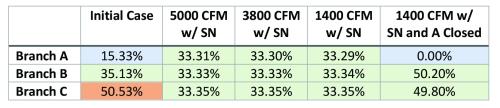
Table 1 summarizes the whole study in terms of flow distribution for each case and for each branch.
Conclusion
Applying a sonic nozzle technology in a compressed air system was very exciting for this case study. Combining this with another cutting-edge technology, computational fluid dynamics/CFD, helped us speed up the process, have a better understanding of the whole system, and simulate different scenarios instead of a costly trial and error process. Lastly, the system was installed three years ago and is still functioning flawlessly.
For more information contact Mustafa Uslu, Mechanical Engineer (M.Sc.), Revindus, email: mustafa@revindus.com, https://revindus.com.
To read similar Compressed Air Instrumentation articles, please visit https://www.airbestpractices.com/technology/instrumentation.
Visit our Webinar Archives to listen to expert presentations on Compressed Air Purification, Pneumatics and Piping at https://www.airbestpractices.com/webinars.
About the Author
Mustafa Uslu is a Mechanical Engineer (M.Sc.) at Revindus – Revolutionary Industries. He has over 12 years of experience in designing, developing, and manufacturing high tech compressed air equipment, and special refrigeration units by using cutting edge technology to meet the unique requirements. Mustafa holds a master’s degree about theoretical and experimental analysis of a refrigerant compressed air dryer on Mechanical Engineering.
About Revindus – Revolutionary Industries
Revindus was founded in 2018 with a vision of offering the high technology products in the industry. The company consist of precise refrigeration and compressed air engineering divisions. Our product offering includes precise gas flow meters, flow computers, lab automation, sonic nozzles, data loggers, compressed air engineering, as well as precisely temperature-controlled refrigeration units, ultra-low temperature chillers (-100°F), freezers, freeze dryers and climate cabinets. The units are built in house including software development, automation, manufacturing, and final testing. Revindus serves multiple industries including gas flow meter manufacturers, medical laboratories, manufacturing, food and beverage, pharmaceuticals, and infrastructure. For more information visit https://revindus.com.