The Facility
This facility is part of a major corporation with dozens of manufacturing facilities where consumer good food products are processed and packaged for shipment to retail outlets. The factory was spending \$210,000 annually on energy to operate their compressed air system. This system assessment detailed four (4) project areas where yearly energy savings totaling \$100,855 could be found with an investment of \$100,000. The over-all strategy for improving this air system centers on getting the controls of the installed air compressors to translate reduced air demand into reduce kW consumption and to reduce over-all demand with compressed air savings projects.
This plant is similar to the majority of plants we encounter. On the surface, there are no problems. Plant pressure and air quality are satisfactory and the air compressors, in general, are performing well with the usual maintenance requirements. This system assessment discovers demand-side opportunities to reduce the consumption of compressed air (from 2,727 acfm to 1,460 acfm) which then allows us to TURN OFF four air compressors – and realize reduced energy and maintenance costs.
Measurement Actions Establish the Baseline
You can’t manage what you don’t measure and the first step of any system assessment is to use the measurement instruments necessary to see what’s happening. The following actions were taken to establish the baseline for flow, power and pressure.
- Temperature readings were taken on all units with an infrared surface pyrometer. These were observed and recorded to relate to the unit’s performance, load conditions and integrity.
- Critical pressures including inlet and discharge were measured with a single Ashcroft digital calibrated test gauge with an extremely high degree of repeatability.
- All units had the input kW measured with a Fluke motor analyzer and recorded with the Hawkeye kW monitors and MDL logger.
- System pressure was measured using an Ashcroft pressure transducer and the same multi-channel MDL data logger. These pressure readings were consistent with the panel gauges on the compressors and the single control pressure transformer mounted in the discharge line downstream from the after-filter.
- An accurate compressor operating performance curve was created for the modulating controlled unit. Each unit has its full load kW measured and its no load (without) blow down kW measured. These were then entered on the appropriate charts. The measured and recorded kW as a percent of full load power was then aligned to the appropriate percent of flow. The recorded kW curves can then be accurately transformed to flow (cfm).
The Baseline: Supply-Side System Overview
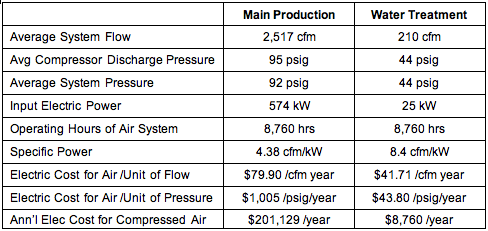
The plant works 8,760 hours per year and has three different compressor rooms all using rotary screw air compressors piped to heatless desiccant air dryers. There is an additional air compressor being used solely for wastewater aeration. The system pressure runs from 75 to 101 psig in the headers during production. Total air demand is 2,517 acfm for plant use plus 210 acfm for wastewater aeration. Specific power is 4.38 cfm/kW for plant use and 8.4 cfm/kW for the wastewater. Specific power is an important compressor efficiency metric as it measures how much cfm is produced per kW of input power.
The first compressor room has compressors #1 and #2. Compressor #1’s variable displacement control system has been changed to two-step control. This unit could not be manually unloaded when compressor #5 was running. Compressor #2’s variable displacement control system was not working properly-the valve would stick in the partially open position. The oil cooler, on this unit, is not performing as designed. These air compressors are in good shape but need to have these items repaired for them to get back to peak performance.
Compressor’s #3 through #6 are all in good working order. Compressor #6 is delivering 45 psig air to the wastewater aeration application and is an example of an inappropriate use of compressed air.
The compressed air dryers are heatless (pressure-swing) desiccant air dryers. They are providing a -40 F (-40 C) pressure dewpoint. The concern here is that they are using the full 15% purge air requirement to regenerate the desiccant beds in the off-line tower. This is an example of artificial demand.
Overall the supply-side of this plant appears to be running smoothly and relatively efficiently for the existing demand levels.
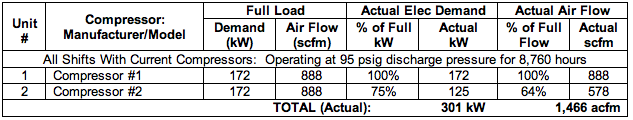
Table 1. The Baseline: Current System Compressor Use Profile
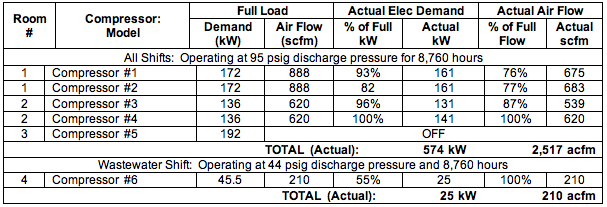
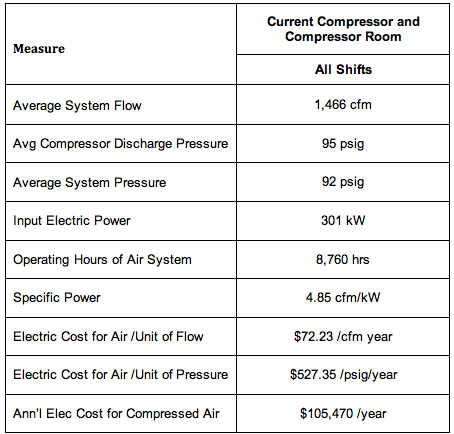
Table 2. The Baseline: Current System Key Characteristics
Demand-Side Projects to Reduce Compressed Air Consumption
The overall strategy for improving the air system centers on repairing purge controls on compressed air dryers and reducing overall demand. The recommended projects include:
| Air Flow Reduction Projects | Air Flow Reduction | |
| Repair purge control on dryer #1 | 180 acfm | |
| Replace vortex cabinet coolers with thermoelectric units | 144 acfm | |
| Repair compressed air leaks | 377 acfm | |
| Use low-pressure blower for wastewater | 210 acfm | |
| Shut-off dryer #2 and eliminate purge air | 360 acfm | |
| Total Compressed Air Flow Reduction | 1,271 acfm |
Project #1: Air Dryers and Dewpoint Monitors
During our site visit, we asked plant personnel remove desiccant samples from all three dryers. The two 2400 cfm heatless dryers, in compressor rooms #1 and #2, have desiccant beds that appeared to be well worn and discolored. The desiccant in both of these dryers should be replaced and monitored/topped off every six months. Topping off the desiccant provides a dual benefit – first, it maintains a bed height for proper contact time to ensure dewpoint integrity. Second, it adds weight to keep the desiccant less mobile and help to alleviate some bed movement and help keep dusting to a minimum.
Both dewpoint monitors on the heatless desiccant dryers, in compressor rooms #1 and #2, are apparently not reading correctly. This is the opinion of plant personnel and Air Power USA personnel. By repairing or replacing the dewpoint monitors, working monitors will help plant personnel have a better handle when the operation of the dryers needs attention – e.g., desiccant condition.
This project completely turns OFF the desiccant dryers in compressor rooms #2 and #3 while keeping #3 available for back-up. This eliminates the 15% purge (360 cfm) generated by dryer #2. The project recommends installing a new dew point demand purge controller on the dryer in compressor #1. This will allow the purge rate to be reduced to approximately 7.5% (180 cfm) during partial load conditions in the plant on this dryer.
Table 3: Compressed Air Dryers
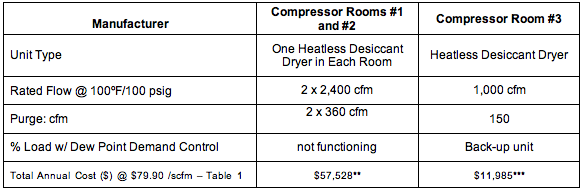
* Based on blended electric rates of \$0.04 per kWh and operation of 8,760 hours per year.
** Two units ***Unit runs in back up.
Project #2: Leak Identification and Repair
Most plants can benefit from an ongoing leak management program. Leak levels in most plants represent 15-25% of total compressed air demand. Generally speaking, the most effective programs are those that involve the production supervisors and operators working in concert with the maintenance personnel. Accordingly, it is suggested that all programs consist of the following:
- Short Term – Set up a continuing leak inspection by Maintenance Personnel so that for a while, each primary sector of the plant is inspected once each quarter to identify and repair leaks. A record should be kept of all findings, corrective measures, and overall results.
- Long Term – Consider setting up programs to motivate the operators and supervisors to identify and repair leaks. One method that has worked well with many operations is to monitor the air flow to each department and make each department responsible for identifying its air usage as a measurable part of the operating expense for that area. This usually works best when combined with an effective in-house training, awareness, and incentive program.
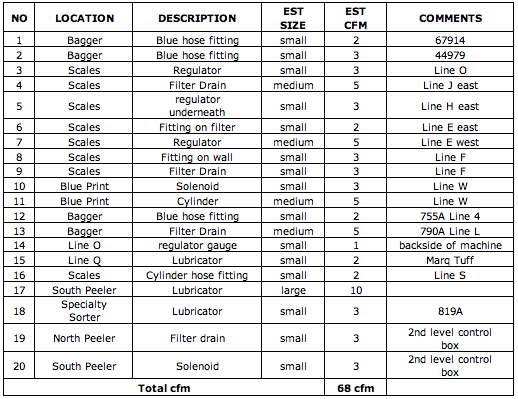
The area surveyed in the partial leak study included a great deal of high background ultrasound noise that shields many of the smaller leaks. In continuing the leak management program, plant staff should perform leak detection during non-production hours in order to eliminate some of the high ultrasonic background noise. We expect a total of at least 377 cfm in air leaks to be found.
Table 4: Identified Leak List (partial)
Project #3: Cabinet Coolers
Cabinet cooling is often required to obtain reasonable life and performance of the electronic equipment in control cabinets. Blowing straight compressed air into the cabinet for cooling is generally not an efficient or cost-effective use of compressed air.
A very effective cooler that can cool below ambient when the heat load is within its capability is a Thermoelectric Air Conditioner which uses the “Pelletier effect” to convert low electric flow into refrigeration. The electric current’s effect on the dissimilar metals pulls the heat from the cold sinks and pushes it through the heat sink and out.
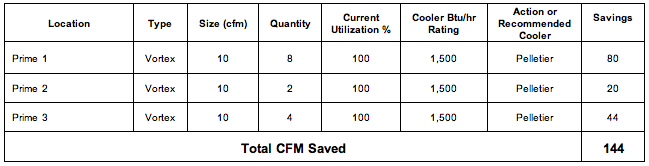
This project replaces 14 cabinet cooling applications from Vortex-type to thermo-electric type using the Pelletier effect. The estimated reduction in compressed air flow is 140 cfm representing a net annual electric savings of \$11,297 per year.
Table 5: List of Cabinet Coolers in Plant
Project #4: Misapplied High-Pressure Air
High-pressure air being used for very low-pressure applications is not an efficient use of energy. A close review of the plant’s system should be made and measurements taken to identify whether there are any potential energy savings from using an alternate source of low-pressure or high-pressure air for specific applications in the production area.
Potential misapplications of high-pressure air include aeration and spraying, where fans, blowers, or low-pressure compressors can reduce energy costs. Low-pressure applications can range from 7 to 60 psid, while typical air systems are set at 90 to 120 psid.
This project replaces the current air compressor providing 210 cfm at 44 psig for wastewater aeration. It will be replaced with a low pressure blower providing annual energy savings of \$6,750.
Project #5: Adjusting Air Compressor Controls
The two most common controls used for rotary screw compressors are modulation and online/offline. Modulation is relatively efficient at very high loads, but inefficient at lower loads. Online/offline controls are very efficient for loads below 60%, when properly applied with adequate time for blow down. There are several other control types—e.g., “variable displacement” (75% to 100% load) and “variable speed drive” (25% to 75% load) – that have very efficient turn down when applied correctly.
The current units have variable displacement capacity controls capable of translating “less air used” into a comparable reduction in electric cost. These controls will work effectively with the current piping and air receiver storage situation.
These variable displacement controls, on compressors #1 and #2, need to be repaired. They must be re-installed correctly to operate efficiently. For only a \$5,000 bill in repair costs, these two units will now efficiently take care of total plant demand that has been reduced to 1,460 cfm.
Table 6. Key Air System Characteristics – Proposed System
*Based on a blended electric rate of$0.04 per kWh, 8,760 hours/year.
Table 7. Compressor Use Profile – Proposed System
Conclusion
Most of the overall system assessment energy savings of \$100,855 are realized due to compressed air demand reductions in dryer purge air, air leaks, different cabinet coolers, and misapplied compressed air. This allowed us to TURN OFF four air compressors.
Compressor control knowledge – and the ability to repair control systems - is what allows the ROI to be only one year. Variable displacement controls can be very effective and in this case, they just needed some repair work to get them back into the “energy-saving” mode. All too often we see plants “give up” prematurely on the control systems of older compressors that still have many good years left in them.
For more information contact Hank van Ormer; tel: 740-862-4112, www.airpowerusainc.com.
To read more System Assessment articles, visit www.airbestpractices.com/system-assessments.