A Tier 1 automotive supplier was concerned its compressed air system was not operating as efficiently as it could be. The situation called for a site visit and metering and evaluation of the company’s air compressors to generate a representative data sample that accurately captured the compressed air needs during typical production and non-production periods.
Using the data collected, Bay Controls recommended a control system upgrade that would enable the automotive supplier to significantly reduce its energy costs by providing improved pressure control and automatically shutting air compressors off during periods of low demand. Based on the company’s production profile and electricity costs, the assessment showed the upgrade would generate annual savings of approximately \$61,000. When combined with incentive payments from the local electric utility, the project would achieve a simple payback of 12 months.
Air Compressor Assessment Moves Forward
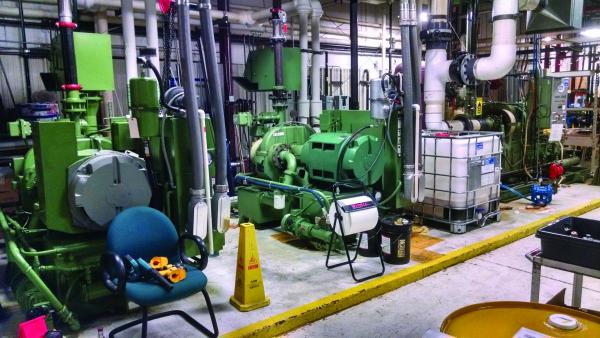
After an initial discussion the Bay Controls team arranged to visit the supplier’s facility to conduct an initial site survey. Doing so provided an opportunity to learn about the automotive supplier’s production process and compressed air needs and also verify the equipment in use, which included one 550 horsepower (hp) three-stage centrifugal air compressor; one 350 hp three-stage centrifugal air compressor and one 300 hp three-stage centrifugal air compressor.
Discussions with the facilities manager and plant operators determined the company’s production schedule consisted of three weekday shifts and two weekend shifts. While plant operators believed all three air compressors ran almost fully loaded during most weekday production shifts, there was a question about how often the air compressors ran during the weekend shifts.
To fully understand the plant’s needs and generate accurate data for compressed air demand and compressor performance and potential savings opportunities, Bay Controls proposed a metered site assessment as a next step. It subsequently installed a short-term metering solution comprised of the following:
- Three current transformers to measure the motor power of each air compressor.
- Three pressure transmitters to measure the discharge pressure at each air compressor.
- One pressure transmitter to measure the compressed air system pressure downstream of the air compressors.
- Three Bay Controls Bay System Integrators to receive and convert the analog outputs of the current transformers and pressure transmitters to digital data. Bay System Integrators are proprietary I/O modules with a variety of analog (-20 mA), RTD, and digital inputs for use with all types of air compressor instrumentation.
- One Bay Controls Bay View Gateway storage device to store data obtained from the system integrators, making it available for later analysis.
The hardware enabled the team to capture Key Performance Indicators (KPIs) during a two-week period, including air compressor motor power (kW), air compressor energy consumption (kWh), compressed air system pressure (psi), and air compressor “blow-off” (% of loaded hours).
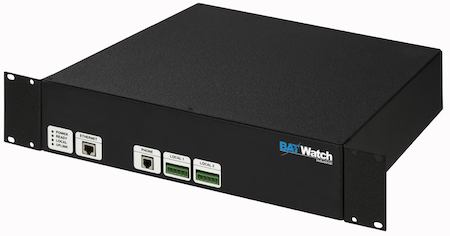
The Bay Controls Bay View Gateway is a data storage device used to collect and store air compressor data for analysis.
After two weeks, the team removed the metering equipment and uploaded the data captured by the storage device to a Bay Controls cloud-based compressor monitoring and analytics platform for analysis. Using KPIs captured, the platform calculated the company’s compressed air needs and energy usage as follows:
Weekly Compressed Air System KPIs
|
|
Weekday Shifts |
Weekend Shifts |
|||
|
1st |
2nd |
3rd |
Saturday |
Sunday |
|
|
Hours/week |
40 |
40 |
32 |
32 |
24 |
|
Operating Energy (kWh) |
660 |
660 |
660 |
425 |
375 |
|
Operating Pressure (psi) |
105.0 |
106.5 |
106.5 |
106.0 |
108.0 |
|
Air Venting (blow-off) (% of loaded hours) |
0.0% |
0.0% |
0.0% |
5.0% |
15.0% |
|
Unloaded Energy (kWh) |
154 |
154 |
154 |
154 |
154 |
|
Unloaded hours/week |
0 |
0 |
0 |
24 |
24 |
Weekly Compressed Air System Energy Usage
|
|
Weekday Shifts |
Weekend Shifts |
|||
|
1st |
2nd |
3rd |
Saturday |
Sunday |
|
|
Total Energy (kWh) |
26,400 |
26,400 |
21,120 |
13,600 |
9,000 |
|
Online Energy (kW) |
26,400 |
26,400 |
21,120 |
9,904 |
5,304 |
|
Unloaded Energy (kWh) |
0 |
0 |
0 |
3,696 |
3,696 |
|
Energy Lost During Air Venting/Blow-off (kWh) |
0 |
0 |
0 |
495 |
796 |
As the data shows, the company was fully utilizing its air compressors during the weekday shifts but was running them unloaded for long periods of time during the weekend shifts and the air compressors were venting air (blowing off) during the weekend shifts. In addition, the plant air pressure was actually higher during the Sunday shift than the weekday shifts (108 psi versus 105-106.5 psi).
Installation Guidelines for Flow Meters – Webinar RecordingDownload the slides and watch the recording of the FREE webcast to learn:
|
Energy Reduction Opportunities Identified
Using the data captured, Bay Controls built an accurate model of the company’s compressed air usage and needs and shared it with the facilities manager. Until this discussion, the facilities manager had never seen his compressed air system data measured and modeled for the weekday and weekend shifts.
When the manager saw the discrepancies in loaded and unloaded operation between the weekday and weekend shifts, he immediately noted that although the system was operating at 106 and 108 psi on the weekends, the plant only needed 82 psi on the weekends. He also said the plant only needed 102 psi during the week (instead of 105-106.5 psi), but the air compressors could not consistently maintain that pressure without being set to a higher set point (105-106.5 psi).
Compressed Air Measurement Monthly e-NewsletterIf there is no Compressed Air Flow, Dewpoint, Oil, Pressure and kWh Measurement, how can one effectively manage the system? Content provides “how-to examples” of System Assessments and Technology Profiles of the required instruments. |
Subsequently, Bay Controls used the data and the facilities manager’s feedback to identify three ways in which the company could significantly reduce compressed air energy use:
- Network the air compressors to enable more precise pressure control.
- Reduce system operating pressure to match plant needs during different periods.
- Reduce unloaded air compressor operation during periods of little or no demand.
The savings estimated for pressure reduction, unloaded operation reduction, and air venting reduction are as follows:
Pressure Reduction Savings (Weekly)
|
|
Weekday Shifts |
Weekend Shifts |
|||
|
1st |
2nd |
3rd |
Saturday |
Sunday |
|
|
Current Pressure (psi) |
105.0 |
106.5 |
106.5 |
106.0 |
108.0 |
|
Proposed Pressure (psi) |
102.0 |
102.0 |
102.0 |
82.0 |
82.0 |
|
Savings (kWh) |
830 |
1,227 |
982 |
2,467 |
1,405 |
Unloaded Operating Hours Reduction Savings
|
|
Weekday Shifts |
Weekend Shifts |
|||
|
1st |
2nd |
3rd |
Saturday |
Sunday |
|
|
Unloaded Operating Hours Reduction |
NA |
NA |
NA |
70% |
90% |
|
Savings (kWh) |
0 |
0 |
0 |
2,587 |
3,326 |
Air Venting (Blow-Off) Reduction Savings
|
|
Weekday Shifts |
Weekend Shifts |
|||
|
1st |
2nd |
3rd |
Saturday |
Sunday |
|
|
Air Venting (Blow-off) Reduction |
NA |
NA |
NA |
70% |
90% |
|
Savings (kWh) |
0 |
0 |
0 |
396 |
716 |
The total potential weekly, monthly, and annual savings by implementing all three strategies are as follows:
Total Savings Potential
|
|
Energy (kWh) |
Energy Cost Reduction ($0.085/kWh) |
|
Weekly Savings |
13,935 |
$1,184.51 |
|
Monthly Savings |
60,553 |
$5,146.98 |
|
Annual Savings |
726,633 |
$61,763.79 |
To achieve these savings, Bay Controls proposed the company upgrade its air compressor controls with the Bay Controls Bay Compressor Controller with scheduling capability. These upgrades would enable the following operational improvements:
- System pressure reductions during both weekday and weekend production through precision pressure control and air compressor networking.
- Reduced unloaded air compressor run time.
- Reduced air venting with improved throttling range.
Utility Incentive Reduces Payback by Nearly 50%
Given the project cost and estimated energy savings of \$61,763 annually, Bay Controls estimated a simple payback of 23 months if the project were paid for up front in cash without any added incentives or rebates. However, the local electric utility was offering an incentive payment of \$0.08 for every kWh in project saving. Using the project’s estimated annual saving of 726,633 kWh, the utility incentive would work out to \$58,130.64, allowing for a simple payback period of 12 months.
About the Author
Stephen Parry, International Sales Manager for Bay Controls, works with customers in the Western United States and internationally to implement projects built around the Bay Controls suite of products, including air compressor controls retrofits, monitoring solutions, and HVAC integration, email: Stephen.parry@baycontrols.com, tel: 419-891-4390.
About Bay Controls
For 35 years, Bay Controls has been providing control and monitoring solutions to a broad range of industrial, commercial, and government customers in the United States and 60-plus countries across the world. The Bay Controls suite of cloud-ready hardware, and a state-of-the-art, cloud-based analytics platform deliver the actionable intelligence companies need to make smart, data-driven decisions about compressed air system operations, energy savings, and maintenance. For more information, visit www.baycontrols.com.
All photos courtesy of Bay Controls.
To read similar Automotive Industry articles visit www.airbestpractices.com/industries/auto.