This major food manufacturing plant in the Midwest uses compressed air and onsite nitrogen generation to operate multiple snack production and packaging lines. The plant spends an estimated \$430,344 annually on energy to operate its compressed air system based on an average rate of 4.5 cents per kWh.
Projects focused on the demand side of the compressed air system at the food packaging operation allowed the plant to reduce its compressed air flow by 689 scfm for an annual energy cost savings of \$54,671. The airflow reduction projects addressed open blows, the repair of nitrogen leaks and the use of air vibrators to keep product moving.
Due to space constraints, this article will show the reader observations our team made on the compressed air demand side of the system and provide insights into these airflow reduction measures.
Compressed Air System Assessment
The plant operates two compressor rooms with its Core Room providing compressed air for the plant’s production area and a nitrogen generation pressure swing adsorption (PSA) unit, while the second room supplies air to the bakery operation.
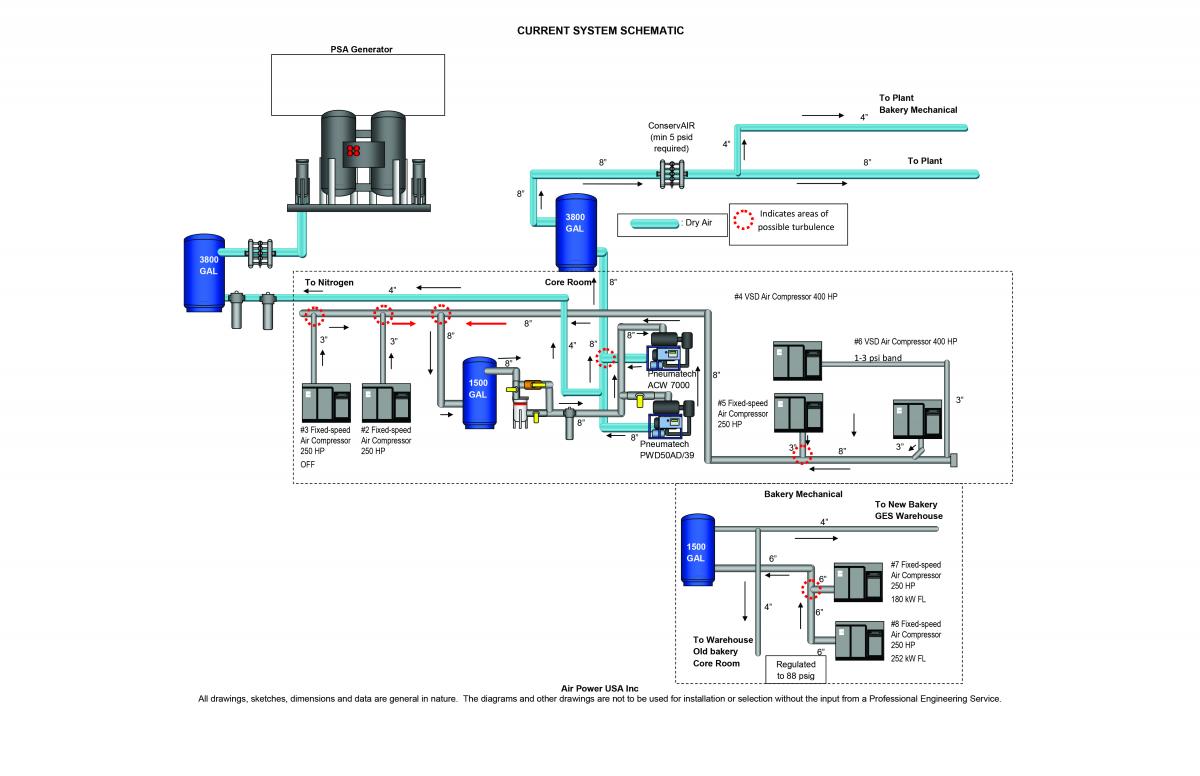
The food packaging plant’s compressed air system is comprised of two compressors rooms designed to supply air to production and bakery areas. Click here to enlarge.
The compressed air system in the Core Room consists of three 250-hp oil-free, fixed-speed rotary screw air compressors, which are piped together with two 400-hp, oil-free Variable Speed Driven (VSD) driven rotary screw air compressors. The five units collectively send their compressed air to two large pneumatic refrigerated dryers.
The bakery compressor room has two 250-hp, oil-free rotary screw compressors with split-stream HOC (heat-of-compression) “drum” type compressed air dryers built into the package.
The compressed air systems in both rooms operate 8,600 hours per year. The load profile (or air demand) of the system is relatively stable during all shifts. Overall system flow ranges from 4,000 scfm to 6,200 scfm with an average flow of approximately 5,200 to 5,500 scfm.
As shown in Table 1, the average system flow for the Core Room is 3,627 scfm with an average air compressor discharge pressure of 105 psig and an average system pressure of 93 psig. Total input power for the Core Room is 748 kW with specific power of 4.85 scfm/kW. The electric cost of compressed air per unit of flow is \$79.81/scfm per year and the cost for air per unit of pressure is \$1,447.38 psig per year. The annual cost of electricity for the Core Room per year is \$289,476.
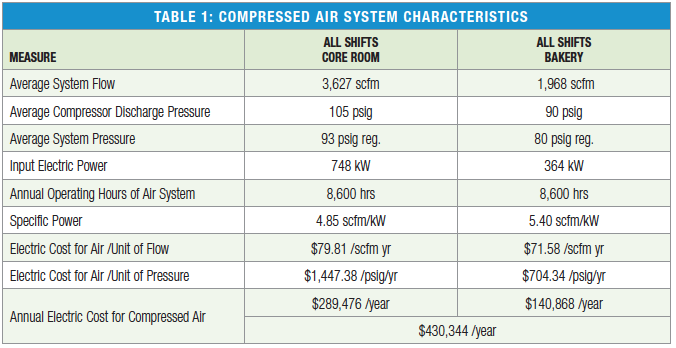
The average system flow for the bakery compressor room is 1,968 scfm with an average air compressor discharge pressure of 90 psig and an average system pressure of 80 psig. Total input power for the bakery is 364 kW with specific power of 5.40 scfm/kW. The electric cost of compressed air per unit of flow is \$71.58/scfm per year and the cost for air per unit of pressure is \$704.34 psig per year. The annual cost of electricity for the bakery compressor room per year is \$140,868.
Combined, the annual cost of compressed air for the plant’s production area and bakery operation is \$430,344.
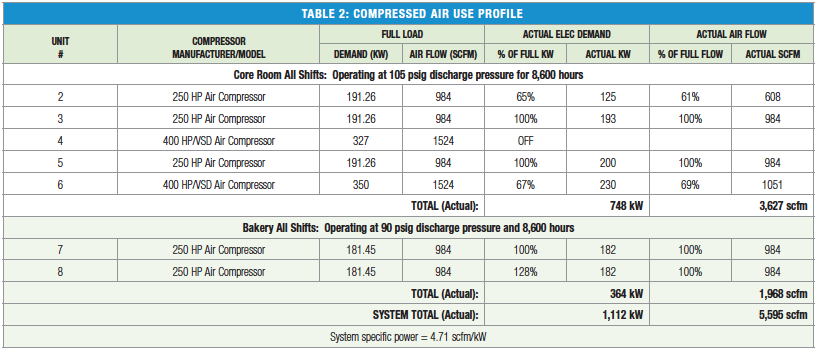
An analysis of air compressor use shows the units in both areas of the plant function quite well. As is often the case when making compressed air assessment, our team finds that an air compressor might be using 100 percent of its rated kW capacity but providing much less airflow than required. This is not the case at this food plant as shown in Table 2 since actual demand in airflow (load) matches the units’ electrical consumption.
Dust Collector System Review: A Must at Food Plants
It’s always important to analyze dust collectors in any food plant. In this plant, we reviewed compressed air use for twelve dust collectors and found the feeds to be well sized, and each had sufficient storage between it and the collector. Demand controls were also working well and the bags are sloughing off properly. Additionally, the units were not running on timers but there were no problems pulling low pressure in surrounding lines and also low pressure to the collector.
In a typical pulse jet dust collection system, the dust is collected on the bag or fingers and when the cake of dust is of appropriate thickness and structure – a pulse or pulses of compressed air – is used to hit or shock the bag and knock the cake off. When the cake is removed correctly from the dust collector, the system removes dust from its assigned environment and has a normal bag life. When the cake is not removed effectively, the dust collector does not remove dust effectively from its assigned environment and bag life can be significantly shortened.
When the feeds and installation are operating properly, the dust collector air usage will operate with less overall demand and better performance with a demand controller. The demand controller, when used without proper compressed air feed conditions, may use more air and decrease bag life and performance.
Proper operation of dust collectors is critical to minimizing cost and maximizing system effectiveness. There are many sizes and most, if not all, use a pulse of compressed air controlled by a timer. Operators set the timers based on appropriate settings for proper cake removal and bag life.
Dust collection system designs specify the air inlet pressure to the manifold and pulse valves necessary for effective dust removal. The pulse valve sends a given volume or weight of air to the bag at a predetermined velocity to strike and clear the cake. The actual amount or weight of air is dependent upon the pulse nozzle being fed compressed air at a pre-determined and steady pressure.
The dust collector must receive the correct pressure (or close to it) and a steady repeatable pressure level for each pulse, particularly if timers are used to control the pulses. The operator may experiment to find the “right timing sequence” at a desired feed pressure. But if this pressure varies, then performance may not be satisfactory.
A problem that often occurs usually comes from the pulsers hitting the bag when the cake is not ready to flake off, or the cake has gone too long between pulsing and grown too thick and heavy to clean effectively. This causes not only short bag life, but also very poor performance. There are usually several basic causes for this:
- Incorrect timer settings for the operating conditions. The actual requirement for the optimum timer setting may well change as various product runs change or even based on seasonally. These settings have to be set carefully to begin with and monitored regularly.
- Lack of sufficient storage or compressed air supply near the inlet manifold to supply the required pulse air without collapsing the inlet pressure. With too low an inlet pressure, the mass weight of the air pulse is too low, which then becomes ineffective in removing the cake.
- Too small a feed line to the dust collector will have the same effect as lack of air supply.
- Too small, or incorrect regulator, which is unable to handle the required “rate of flow” required by the dust collectors.
All of these situations cause restricted airflow. They occur because, prior to the installation or prior to some operational change, the proper “rate of flow” was not identified for the dust collection action. Feed line sizing, regulator sizing, and air supply all require an identified “rate of flow.” The “average flow rate” cannot be used.
“Flow rate” is the average flow of compressed air in cubic feet per minute either required by a process or delivered to the system. “Rate of flow” is the actual rate of flow of compressed air demand in cubic feet per minute. Even relatively small air demands in cubic feet can have a very high “rate of flow” if they occur over a very short time period. Dust collectors have this characteristic.
The sequence controllers can have a very significant impact on the required “rate of flow.” For example, a dust collector system with six pulsing valves can use 3.5 cubic foot (cu. ft.) over one-half second for each pulse.
The impact of these two different “rates of flow” would show similar differences in regulator sizing, etc., if they were used on the feed line flow. The high flow velocities entering the manifold and controls for the pulse valves will create extra pressure loss through the balance affecting the performance of the pulse cleaner. The same sort of effect would show up in air receiver sizing to minimize system and feed line pressure drop if that is a question.
Quality Pressure Gauges Recommended
We typically recommend a quality pressure gauge be installed near the dust collector entry for every feed line. Observe the pressure gauge, which the pulser hits. If the pressure drop is too high (over 10-20 psig), start looking for the cause. Get the specification on the dust collector, cfm per pulse, feed line pressure time per pulse, cycle time between pulses, etc. Then calculate the rate of flow, check line size and storage to determine if more storage is needed.
Significant amounts of air (10 to 15 cfm or more) can be lost when the control diaphragm and/or connections fail. Such leaks are very difficult to find and repair.
Proper sizing and installation of appropriate storage for dust collectors offers opportunities to convert high volume short-term demand to lower average rate of flow. The regulator should be installed after the receiver whenever a short high demand pulse is not required (less than one minute).
Adding appropriate storage may not only be a direct energy issue but one of air quality. Proper control of the dust collectors will protect surrounding systems from falling pressure at nozzle blow. This should also enhance the dust collector performance and extend bag life. Dust collectors are a significant source of leaks that are hard to detect. Often the pulse control diaphragms leak. An electronic airflow alarm can signal this problem visually and remotely.
After the system is stabilized and reconfigured, review each dust collector operation to ensure proper bag sloughing, working demand controls, and ensure there no negative effects on adjacent equipment.
Addressing Open Blows, Achieving Optimal Blow-Off
An audit and thorough evaluation of the compressed air systems in both areas of the plant revealed the ability to reduce airflow by several means. One project involved the repair of open blows.
Turbulent compressed air blasts straight out of a given pipe or tube. It not only wastes huge amounts of compressed air, but also violates Occupational Safety and Health Administration (OSHA) noise and dead-ended pressure requirements. Air jets and air flow-inducing nozzles used in place of open blows can reduce noise level, lower compressed air use, and most often improve blow-off operation in both productivity and quality.
The plant installed appropriate Venturi amplifiers and controls. It also began clearing more holes with mechanical means and reducing the use of blower-supplied air for clearing. The corrective measures reduced airflow demand by 305 scfm and the amount of energy consumed by 539,644 kWh for an annual savings of \$24,284.
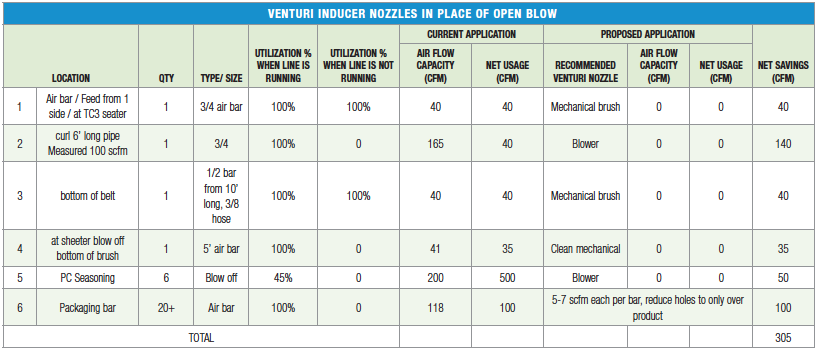
Shown is the application of Venturi inducer nozzles and the cfm savings for each application.
There are a number of air-jets and airflow-inducing products available. A test of one nozzle may vary somewhat from another nozzle of the same manufacturer, but not significantly. Here are important points to remember:
- In blow-off, thrust from pressure (psig), is required to loosen the objects to be removed.
- Thrust dissipates very rapidly once the air has left the “blow-off” device.
- In blow off, volume of total air (cfm), compressed air plus induced air, is critical to carrying the blown-off material away within the air stream.
- Use expensive compressed air only as a last resort; mechanical, hydraulic, etc., will always be more energy economical and often safer.
- All blow-off air should be regulated to the lowest effective pressure. Higher pressure means higher flow, which may not be needed; higher-pressure air costs more to produce. Blower pressure air is cheaper.
- Use Venturi air amplifier nozzles whenever and wherever possible – properly selected and applied for needed thrust and volume, this will usually reduce blow-off air at least 50%, freeing up more air flow for other more valuable applications.
- All blow-off air should be shut off (automatically) when not needed for production.
- When blower-generated air is available or apparently economically feasible, always compare the net energy cost to alternatives.
Better Nitrogen Control, Better Air Vibration Method
A second airflow reduction project focused on the plant’s use of nitrogen (N2) as applied on most of its bagger systems, except for one product. The team observed 20 baggers in one area.
Nitrogen is generated on site with a 580-scfm maximum generator with automatic controls. Liquid N2 is used as backup. Nitrogen use is 320 to 350 scfm of N2. The purity level is 99.7 to 99.8 percent. Average compressed to N2 generation ratio is about 5 to 1. Every 350 cfm of N2 requires an average flow of 1,750 scfm, plus about 1,500 or more purge air every 60 to 65 seconds. Often when the line is stopped the N2 is still running. During a site visit, approximately seven baggers were left on with the line not running, which amounted to 3 to 20 cfm of air each.
The plant implemented automatic shut off controls to address the issue. It turns off N2 when it’s not required. It also installed control valves to regulate the amount of N2 used. The corrective measures reduced airflow demand by 300 scfm and the amount of energy consumed by 530,800 kWh for an annual savings of \$23,886.
Finally, the plant implemented a better method of using air vibrators to keep product or packaging moving or separated, e.g., keeping lids separated prior to sealing. If a plant employs air vibrators that use about 10 cfm each, they will require about 2.5 hp or more to produce the same as a similar electric vibrator, which might use about 0.25-hp input energy. The corrective measures reduced airflow demand by 84 scfm and the amount of energy consumed by 144,480 kWh for an annual savings of \$6,501.
Conclusion
The food packaging operation achieved its main objective of implementing cost-effective methods to reduce demand for compressed air in key production areas and the plant bakery – and saved costs in the process. The operation continues to assess and implement methods to further reduce demand for compressed air and improve its supply operation to achieve additional savings.
For more information contact, Contact Hank van Ormer, email: [email protected], tel: 614.580.2711
To read more System Assessments on End Uses in plants, please visit www.airbestpractices.com/system-assessments/end-uses.
To read more Food Industry articles, please visit www.airbestpractices.com/industries/food.