EnSave, an energy auditing company based in Richmond, Vermont, recently performed compressed air audits at two facilities of a leading U.S. steel manufacturer. Both plants are mills that melt, cast, and roll steel to produce a variety of products, including: rebar, merchant bar, steel flats, rounds, fence posts, channel bar, steel channels, steel angles, structural angles and structural channels. These products are used in a diverse group of markets, including: construction, energy, transportation and agriculture. Compressed air is provided at 100 psig in both plants for a variety of applications — from optical sensor cooling to pneumatic cylinders for stacking finished products.
Plant A has a net annual capacity of 360,000 tons of steel products per year, while Plant B has a net annual capacity of 500,000 tons per year. EnSave worked with Plant A in the summer of 2013 as part of a utility energy efficiency program that provides cost-sharing for the audit report, as well as incentives for implementation. Following the study at Plant A, the steel company recognized the value of compressed air energy efficiency and contracted with EnSave to provide an energy audit at Plant B based on the merits of estimated savings. This speaks to the high value of a compressed air audit to deliver quick, cost-effective energy savings to industrial clients.
EnSave’s systems approach assumes a “blank slate” that includes a review of both supply- and demand-side factors. This approach has allowed EnSave to find multiple compressed air opportunities that had previously been overlooked. Many plants assume that their compressed air system is operating as designed as long as there is sufficient flow and pressure to meet production demands. In reality, all control strategies are set up with the best of intentions, but can stray over time due to a number of reasons. Instrumentation can drift, compressor performance can deteriorate, hardware can fail, and plant demands can change from the original design.
|
“All control strategies are set up with the best of intentions, but can stray over time due to a number of reasons. Instrumentation can drift, compressor performance can deteriorate, hardware can fail, and plant demands can change.” — Eric Lee, Senior Engineer, EnSave Inc. |
One component of the audits that has proved to be particularly beneficial has been the performance testing of compressors through their full design range. This attention to compressor testing has yielded many unexpected opportunities for compressor replacement, control repair and modifications, and leak abatement program development. The focus of this article is to highlight some of these “surprises.”
Issues with Compressor Capacity and Control
The compressors in Plant A have been in service for 4 years and are located in a central mechanical room, while the compressors in Plant B have been in service for over 15 years and are located in two mechanical rooms. Both plants operate 24-hour shifts with 14-day turnaround schedules.
There were three, 500-hp rotary screw compressors in Plant A controlled in a master-slave configuration. One of the compressors acts as the master, and the remaining compressors are on a timed lead-lag sequence controlled by the master unit. All compressors were load/no-load compressors and were cycling every 10 to 20 seconds.
The compressors in Plant B were controlled from a master control panel with real-time compressor staging based on demand. The six screw compressors in use were staged with two base-loaded units and four trim units. The compressors were located in two compressor rooms, with five in one, and one in the other. While the master controller was designed to maximize the efficiency of the system, there were still multiple trim machines running that were part-loaded.
Capacitance Issues Drive Up Costs
In the case of Plant A, an initial review of the system components showed the equipment was mismatched in size. The three compressors were identically rated for 2187 cfm each for a total connected capacity of 6561 cfm, while the dryer was sized for 3816 cfm. The system was designed for two compressors to be operational with one in backup, and that was how the system was found. With just two compressors, the full flow is 4374 cfm. To confirm the capacity of the compressors, a pump-up test was conducted with a known fixed volume consisting of the piping and the wet-side receiver.
Based on the results of the pump-up test, it was determined that the compressors were operating at design capacity, and 15 percent over the rated dryer capacity at full flow. Since the compressors are fully loaded or unloaded, it was determined that the short cycling of the compressors was directly correlated to the lack of system capacitance prior to the dryer, which reduced the actual effective control band (Figure 1) of the compressors.
Figure 1: Impact of effective control band with compressor load cycles
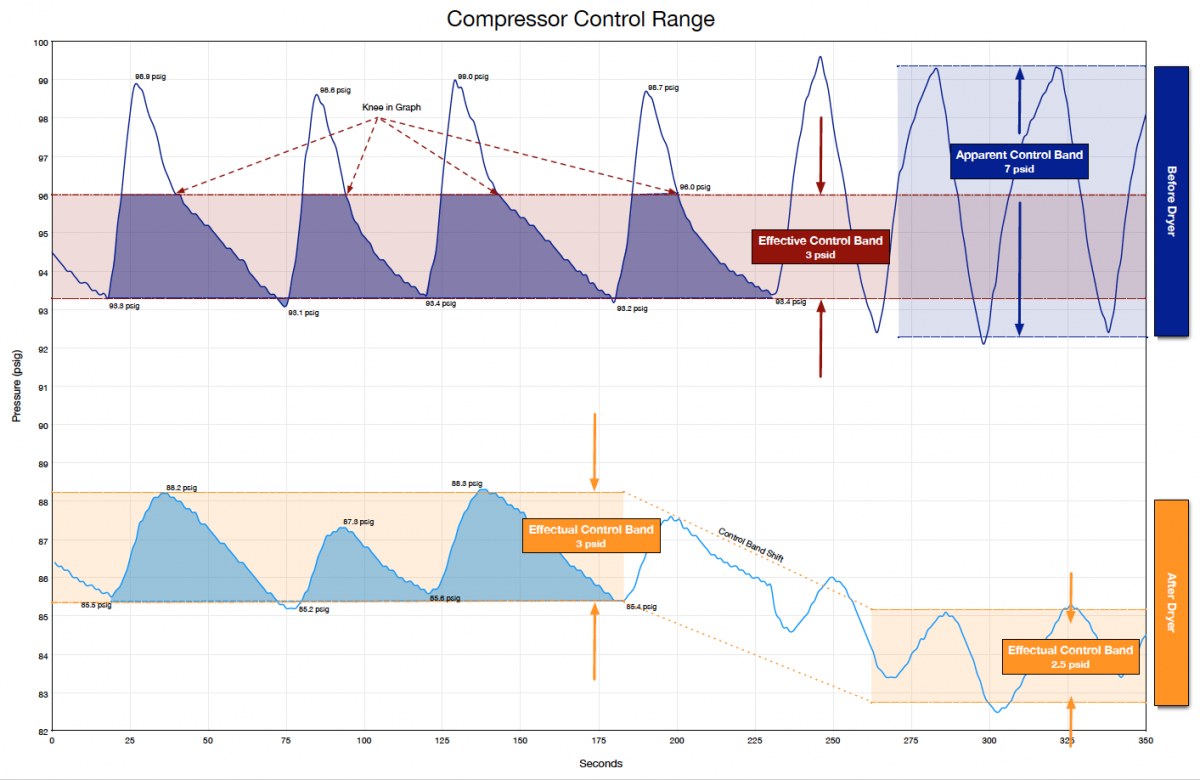
Click here to enlarge
Two options were considered for solving the problem: Increasing the capacitance of the wet-side receiver, or installing a variable frequency drive (VFD) compressor that could more closely respond to demand without overloading the dryer. The choice was made to install a VFD compressor, and the pump-up test results were utilized to more accurately recommend that the compressor be downsized to 350 hp. The annual savings achieved with this measure was 789,346 kWh.
|
“The choice was made to install a VFD compressor, and the pump-up test results were utilized to more accurately recommend that the compressor be downsized to 350 hp. The annual savings achieved with this measure was 789,346 kWh.” — Eric Lee, Senior Engineer, EnSave Inc. |
Performance Testing Identifies System Inefficiencies
In the case of Plant B, the master controls were originally set up for real-time staging of the compressors by matching the plant demand as defined by the compressors’ rated performance and the rate of pressure decay of the system. As such, the sequencing of the compressors was predicated on the compressors operating as originally specified. With this in mind, flow-to-atmosphere tests were specified and conducted on all six compressors on-site to confirm both the full-load performance and the control response of the compressors.
The compressors were isolated, and flow-to-atmosphere tests were conducted with the use of an LP orifice flow meter, which measured the delivered cfm performance of the compressor to atmosphere. This data was then corrected to scfm at 14.5 psia, 68°F and 0 percent relative humidity per CAGI definition.
|
Table 1: Summary of Full-Load Test Results |
||||||
|
Compressor |
CA1 |
CA2 |
CA3 |
CA4 |
CA5 |
CA6 |
|
Rated Power (hp) |
200 |
200 |
300 |
150 |
300 |
150 |
|
Actual Motor (hp) |
200 |
200 |
350 |
200 |
350 |
150 |
|
Control Type |
Variable Port |
Variable Port |
Variable Port |
Variable Port |
Variable Port |
Variable Port |
|
Rated Flow (acfm) |
866 |
866 |
1300 |
650 |
1521 |
760 |
|
Rated Pressure (psig) |
100 |
100 |
100 |
100 |
100 |
100 |
|
Test Pressure (psig) |
105 |
98 |
90 |
111 |
96 |
102 |
|
Test Flow (scfm) |
744 |
791 |
1025 |
721 |
1369 |
722 |
|
Corrected Flow (scfm @ 100 psig) |
803 |
777 |
935.6 |
790 |
1241 |
735 |
|
Peak Test Power (kW) |
179.9 |
155.2 |
230.1 |
142.1 |
260.2 |
129.9 |
|
Service Factor |
1.21 |
1.04 |
1.03 |
1.27 |
1.16 |
1.16 |
|
Flow Variance |
-7% |
-10% |
-28% |
22% |
-18% |
-3% |
Based on the full-flow results, it was seen that only two of the six compressors had a variance of less than +/- 10 percent of rated performance. In addition, it appeared that one compressor (CA4) was completely rebuilt with an airend that did not match the original specifications, and a motor was up-sized to accommodate it.
|
“Based on the full-flow results, it was seen that only two of the six compressors had a variance of less than +/- 10 percent of rated performance. In addition, it appeared that one compressor was completely rebuilt with an airend that did not match the original specifications.” — Eric Lee, Senior Engineer, EnSave Inc. |
In addition to the difference in performance that was measured, the following mechanical repairs were noted for improvement:
- The variable port controls on CA1, CA4 and CA5 were not unloading appropriately, as pressure continued to rise as demand was decreased during the tests.
- CA2 unloaded but demonstrated a great amount of instability during testing, which brought into question inlet controls that might be impacting the compression ratio.
- CA6 had variable port capability but was set to operate as an inlet modulating machine.
These observations during testing led to recommendations that included repair of existing compressors, replacement of a poorly performing compressor, and the reprogramming of the master controls to better reflect the performance of the compressors. The savings opportunity with these measures was 992,727 kWh.
5 Tips on Optimizing VFD Air Compressors – Webinar RecordingDownload the slides and watch the recording of the FREE webcast to learn:
|
The Savings
The total savings associated with both projects totaled 2,977,259 kWh if all measures were included. For this article, only the savings associated with the measures identified with performance testing were listed. The combined savings totaled 1,782,073 kWh with a combined simple payback of 4.3 years without any utility incentives.
About EnSave Inc.
The principals of EnSave’s industrial energy efficiency group have spent their careers working with customers to develop cost-effective energy efficiency strategies. Our engineering staff helps bridge the gap between management and maintenance personnel to deliver energy efficiency solutions that provide a clear, measurable outcome. At EnSave, we know that superior engineering expertise alone is not enough. Our clients need and deserve a partner who understands their business objectives.
EnSave’s industrial group has performed hundreds of industrial energy efficiency projects since 1988. Assessments of medium to large industrial sites have included food processing, primary metals, aerospace, automotive, petrochemical and others. We have broad experience in energy efficiency (including compressed air, pumping systems, refrigeration, motors, lighting), energy optimization, measurement and verification, basis of design, commissioning, retro-commissioning, project management, energy efficiency codes and standards, and sustainability planning.
EnSave also maintains an agricultural practice area focused on energy efficiency, environmental management, and sustainability planning for America’s farms. EnSave is a leading designer and implementer of agricultural energy efficiency programs.

For more information, contact Eric Lee, tel: (208) 806-1815, or visit www.ensave.com.
To read more about System Assessments, please visit www.airbestpractices.com/system-assessments.
To read more about applications for the Metal Industry, please visit www.airbestpractices.com/industries/metals.