A Canadian paper products company is struggling with their compressed air system amid a downturn in their product demand. The compressed air system is the life’s-blood of the plant, supplying critical energy to their production processes, yet the failure of any one of their four air compressors will take down the plant. Plant management was seeking answers as to why their compressed air loading had increased to consume their full capacity in the past few years. This article discusses the findings of a recent compressed air assessment and some possible potential improvements.
Air Compressor Maintenance Costs Add Up
The facility has a compressed air system consisting of four, 200-horsepower (hp) two-stage water-cooled lubricant-free reciprocating air compressors (Figure 1). The air compressors are controlled individually with local pressure switch controls connected to a common pressure sensing point. These air compressors have been operating since the mid-1960s and are very difficult and expensive to maintain because parts are scarce and service companies with experience servicing this type of air compressor are difficult to find.
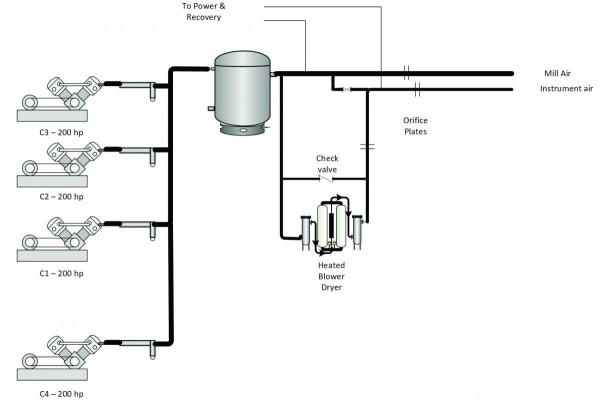
Figure 1: The compressed air system consisted of aging high maintenance lubricant-free reciprocating air compressors and a troublesome heated-blower desiccant air dryer.
The compressed air system is configured into two systems, undried mill air and filtered and dried instrument air. One 1,900-cfm heated blower purge air dryer is installed to condition the instrument air.
The air produced by the air compressors first runs through a large 4,000-gallon wet receiver and then splits to the mill and instrument systems. The compressed air is transmitted throughout the plant through a system of steel piping, with the mill air a 6-inch supply size, instrument air a 4-inch supply. The piping consists of radial feeds running to various areas in the plant.
In recent years the plant has been experiencing capacity problems. In the past, only three air compressors were required during full production, with one spare, but now all four air compressors are required, and even then, there are periods of time where the pressure falls to low levels because the plant demand exceeds the air compressor capacity.
The plant’s instrument air system has, in recent years, been suffering from low pressure, even though the plant air compressors are apparently producing air at an adequate pressure.
Key Measurements Establish System Baseline
Plant management decided to call in a compressed air auditor to measure their system. Data loggers were placed on all the air compressors and the dryer to measure power, with pressure loggers located at various locations throughout the plant to assess the pressure gradient. The existing plant flow meters were also monitored by the same data logging system to capture plant flows. This information was all combined into a single database so the system baseline could be determined.
Part of the assessment included leakage detection and an assessment of various end uses of compressed air. This was done using an ultrasonic leak detector, with all leakage tagged and entered into a database, including photographs of the locations to assist maintenance staff in finding them when repairs are done. Based on the current electrical costs the following baseline was captured (Figure 2).
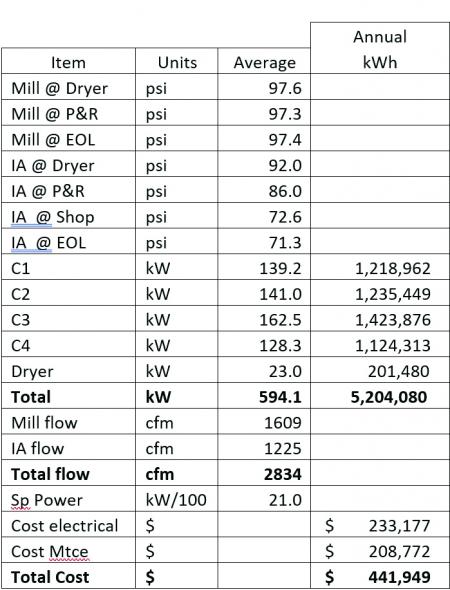
Figure 2: The system baseline showed excessive pressure differential and higher than normal maintenance costs. System efficiency and operating costs could be improved by lowering discharge pressure and using more modern and more efficient air compressors.
The baseline showed a very significant pressure drop between the inlet of the air dryer and the end of line of the instrument air system.
Visualizing KPI’s: Specific Power, Flow, Pressure, Dewpoint - Webinar RecordingDownload the slides and watch the recording of the FREE webcast to learn:
|
For this site, the maintenance costs for the air compressors and air dryer have been tracked for a number of years. The typical rule-of-thumb maintenance cost component for a compressed air system running full time should be in the five to 15 percent of electrical cost range. In this case, the average annual costs to maintain the equipment was near 90% of the electrical costs. For this site the electrical costs are actually quite low, about 4.5 cents per kWh, which by default changes the operating cost percentage compared to a plant with 10 cents per kWh. But, the age of the air compressor, travel time to this fairly remote site, and high parts costs have driven the annual cost to operate these obsolete air compressors very high.
The readings and observations during the measurement period showed the air compressors (including dryer) are producing compressed air at acceptable efficiency (21 kW/100 cfm), but that improvements could likely be made if newer, more efficient air compressors were used. Plant loading has increased so much in the past years that all four air compressors must run to carry the total flow, three fully loaded with the fourth operating in trim duty, this represents a risk to production should one air compressor fail.
The mill air pressure is higher than required due to uncoordinated air compressor control, the need to boost discharge pressures to correct low instrument air pressure, and to ride out transient high flow events that pull down mill air pressure to as low as 70 psi, with instrument air pressures falling to 50 psi. Significant improvements on the supply side are possible by adding more efficient base air compressors, changing the way the air compressors are coordinated, reducing discharge pressure, changing dryer operation, and reducing air compressor area leaks.
On the demand side there is significant energy consumption wasted due to the flow consumed by blowing, electronic enclosure cooling and leakage. The instrument air pressure is very low due to a large pressure differential (10 to 15 psi) across the system.
The study found there is a good potential for energy savings if some wasteful end uses can be reduced or eliminated, and that significant energy incentives are available to fund improvements if these projects are initiated.
Improvements to the low-pressure problems during high flow on the instrument air system can likely be achieved by using surplus storage receivers already located on site, and by reconfiguration of the piping on the discharge of the instrument dryer (adding a check valve to prevent back flow during transient events on mill air).
Air Compressor Technology Monthly e-NewsletterWith a focus on Supply-Side Optimization, air compressor technologies and compressor control systems are profiled. System Assessment articles detail what compressor controls allow kWh consumption to match system demand. |
Pressure Profile Reveals Issues
The pressure profile taken during the assessment (Figure 3) showed a very surprising characteristic. The pressure at the instrument air dryer normally runs about 92 psi, yet the pressure at Point 2 and Point 4 on the chart is very low, running near 72 psi. The piping for this system is well-sized but Point 2 is not very far away from the dryer discharge, this indicates some unanticipated pressure restriction in this section of piping. Additional pressure test ports were installed for secondary readings, and the pressure loss traced to one specific point, an old flow meter orifice plate that was still installed in the instrument air piping.
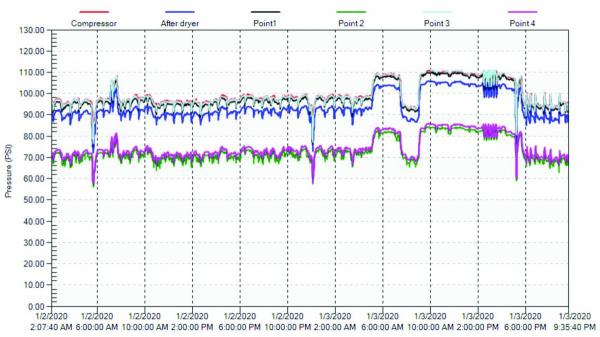
Figure 3: The pressure profile taken during the assessment showed excessive pressure loss on the instrument side. The green and the magenta traces show a large differential from the discharge of the air dryer (blue trace). All other readings track the air compressor discharge pressure because they are on the upstream side of the air dryer and filters.
During the investigation of the pressure differential some excessive pressure loss was also found across the air dryer discharge filter. The differential gauge on this filter was showing no pressure loss, however the data loggers showed about seven psid during high flows. The filter was replaced during the assessment, and the pressure differential fell to one psi.
Finding Inappropriate End Uses and Leaks
The ultrasonic testing found 31 significant leaks totaling about 150 cfm. The infrastructure of the plant is aging, and with it leaks seem to spring out of nowhere. The plant had purchased their own leak detector and was part way through a focus on leakage repair by the time this assessment was done.
Ultrasonic leak detection is also useful for finding inappropriate use of compressed air. Fairly recently the plant personnel started using compressed air-cooled cameras and installing vortex style coolers to condition sensitive electronic enclosures. A total of 23 air-powered coolers were found and measured with a portable flow meter, adding up to 445 cfm of compressed airflow. The plant was already using refrigerated style coolers in some of their enclosures, the power consumption of these is about 75% less than compressed air-powered coolers.
In addition to the leaks and cooling, some important pieces of process equipment had been fitted with numerous compressed air open blow nozzles to solve a process problem. Special testing was done during plant shutdown that showed the nozzles consuming about 730 cfm of compressed air making up about 25% of the total compressed air demand. Figure 4 shows the proportion of the inappropriate uses compared to other process loads, with leakage, blowing and cooling consuming almost half of the total plant flow. This answered the question as to why three air compressors were no longer enough to handle the compressed air demand.
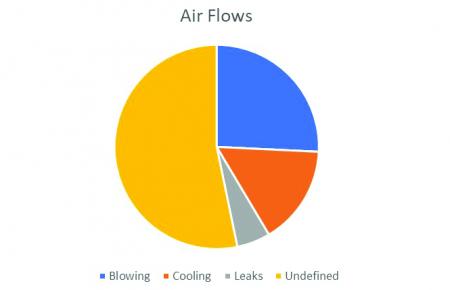
Figure 4: Compressed air demands classed as inappropriate uses consume almost half of the compressed air demand in the plant.
Recommended Pressure and Energy Improvements
The compressed air auditor estimated significant savings could be gained if the following measures were implemented:
- Replace the most troublesome air compressors with more efficient new or refurbished lubricant-free rotary screw air compressors, this will give adequate spare capacity and allow reduced maintenance.
- Improve the air compressor control by installing a sequencing controller.
- Remove the offending orifice plate, reduce the average air compressor discharge pressure.
- Repair 100 cfm of leaks.
- Eliminate 250 cfm of inappropriate uses by installing electric enclosure coolers and eliminating or optimizing blowing.
- Switch to refrigerated air dryer from desiccant for instrument air.
- Install 5,000 gallons of surplus storage receiver capacity on the instrument air system to prevent pressure dips during high flow transient demands.
- Install 3,000 gallons surplus storage capacity at transient demand to smooth out the flow.
It is estimated these energy efficiency measures would reduce the compressed air costs by 33%, saving about \$79,000 per year in electrical costs and \$60,000 in maintenance costs. This project would qualify for a substantial utility incentive if implemented.
The Value of System Measurement
Once again, the value of performing a full measurement of the compressed air system is shown in the unanticipated discoveries made during this assessment. The plant was suffering from reduced pressure due to an unexpected cause; this was located by special testing. Air compressor capacity was lacking due to the addition of more and more inappropriate uses over time, finally reaching the full capacity of the system. The maintenance costs were much higher than normally seen on similar systems do to obsolescence and age. Many of these items were not previously known by plant management.
The plant engineering staff is now working hard to address the deficiencies, with an improvement in pressure, and significant reduction in operating costs on the horizon.
For more information about this article, contact Ron Marshall, Marshall Compressed Air Consulting, tel: 204-806-2085, email: [email protected].
To read more articles about the paper industry, please visit www.airbestpractices.com/industries/paper.