Energy management requires accurate and repeatable measurement of critical data, which is easily monitored and analyzed as required to stimulate required action. When a compressed air system assessment is implemented, the basic minimum measurement protocol to establish the baseline (pre‐measurement) and qualify and quantify the results (post‐measurement) is often:
- Flow (scfm), pressure (psig), input power (kW)
- By individual air compressor
- For the whole air system
- Pressure dew point
This data trended and applied to the identified operating profile generates an accurate annual operating energy cost baseline and proposed modified operating cost. The post‐measurement will then generate an accurate new baseline with the modified air system.
How Do We Get Data During a System Assessment?
Sometimes the data comes from the plant’s current data acquisition system - if it is accurate (we often find current systems are old and/or basically out of calibration, etc.). What is most often the case, the assessment team installs temporary metering equipment. With this data, the operating health problems of the system are identified, the recommended changes implemented and the results measured and identified.
At the end of the assessment, these meters are often removed, yet the true objective of this whole exercise was not just to identify, implement, and create savings, but also to maintain these savings on a continuing basis throughout the future and even to improve on them. We call this “savings persistence” or “savings sustainability.”
The main thought that should jump out here is: Why did we remove the measurement equipment that allowed us to identify the problem during the system assessment? Plants require the same or even a more complete measurement and monitoring system to give the operating personnel the ability to maintain the optimization profile and to continue to monitor and report the current situation with their compressed air system.
Plan to Leave the Flow Meters in Place!
On a recent audit at an appliance manufacturer, the pre‐assessment meetings led to the plant purchasing insertion flow meters able to read and log (500,000 data points) accurately in “wet air” - along with pressure and temperature. The assessment team installed the meters in prepared locations and developed the data required for the complete pre‐ and post-measurement.
At the end of the assessment project, the assessment team worked with plant personnel to complete the permanent monitoring and measurement system including reporting critical data to plant management on a continuing basis. Future plans will expand the monitor/measurement system.
Stabilizing the compressed air flow relative to identified compressed air demand now allows accurate measurement of true input energy savings for future projects such as lowering operating pressure, continued leak repair, shutting off air supply to equipment not in use and installation of air‐saving devices.
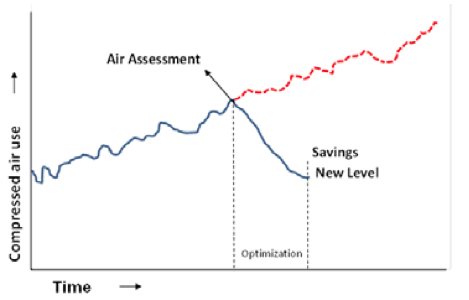
Figure 1. Projected operational energy savings after a system assessment and project Implementation using measurement instrumentation.
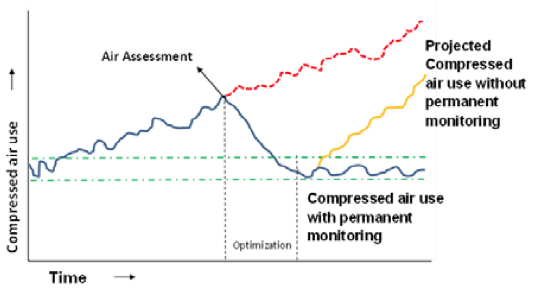
Figure 2. Achieving “Savings Sustainability”. Compressed air usage with effective use of permanent measurement/monitoring.
Words of Caution When Using Air Compressor Input Power (kW) to Estimate Compressed Air Flow
A significant percentage of compressed air system assessments estimate compressed air flow use, in the plant, by using air compressor input kW measurements. Estimating air flow, from basic air compressor performance input kW at actual pressure, can be used to estimate the scfm flow from an air compressor when the accurate OEM operating data is available, particularly in positive displacement compressors. It’s important, however, to understand when this method can go wrong.
When relying on kW to estimate the flow at the discharge pressure, be sure to evaluate:
- How is the kW measured? Check the known measurement against a calibrated motor analyzer (such as a Fluke 41 or 43).
- Identify by measuring each leg for amps, volts, power factor, etc. Determine all the legs are in balance and what is the estimated motor efficiency.
It is important to realize that there are other things that can cause higher kW - in addition to the direct work utilized in producing the compressed air flow at discharge pressure.
Figure 3 shows the measured kW of two identical air compressors and identified a significant disconnect problem. These two identical 300‐hp class units were installed next to each other (full load rated input kW at 100 psig = 225 kW each). Unit #2 consumed 215 to 225 kW – that was OK. Unit #1 consumed up to 325 kW – up to 100 kW more than Unit #2! Unit #1 had been running this year for seven years. At \$48,000 per year of extra energy cost, this represented \$336,000 of wasted energy. The reason was a problem on the disconect. Other issues can cause the kW number to not accurately represent flow such as motor rewinds causing deteriorating efficiency and connective wiring issues. In this example, if this kW number had been used to represent air flow, it simply would have been false.
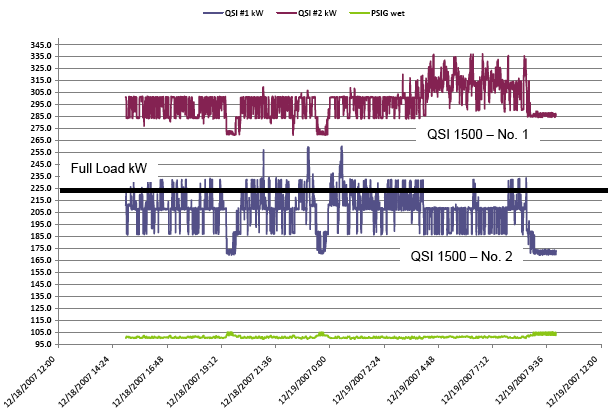
Figure 3. Both No.1 and No. 2 Units delivered approximately 1,335 scfm at 100 psig (flow meter measures)
The Data Sampling Interval, of kW, is Critical
Step‐controlled positive displacement compressors deploy either 2‐step, 3‐step, or 5‐step capacity controls. Trended data can be used to identify the time frame for both loaded and no‐load periods and identifying the percent of flow for each unit. Again, using the air compressor rated performance data for full load acfm/scfm flow allows this method to generate a relatively accurate flow volume for the trended condition. This method also has to be implemented with care.
Whenever the protocol calls to generate a flow volume estimate at pressure from input power data, the data point sampling interval is very critical. Any time logged data is used for diagnosis, as opposed to establishing averages as in the case of “step‐type” capacity controls, the sample rate must be close enough to be sure every cycle point is included or the result will not accurately reflect the load/unload profile, and therefore, the generated flow data will be skewed. It should be noted that when using kW to project probable flow, kW should be measured directly reading amp, volts and power factor simultaneously. It should be noted that when using kW to project probable flow, kW should be measured directly reading amp, volts and power factor simultaneously.
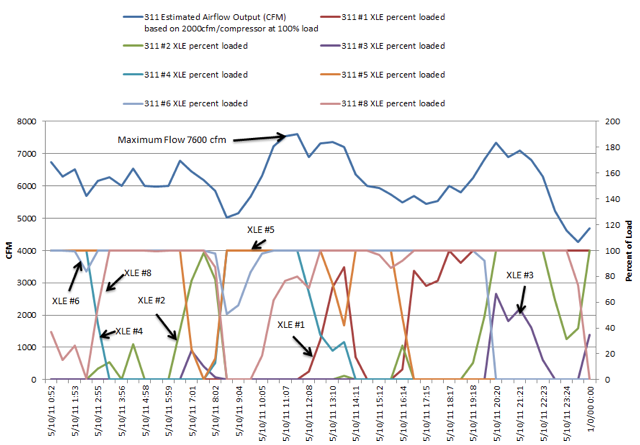
Figure 4. 30-minute data sampling interval of six 400 hp air compressors.
The chart in Figure 4 shows data taken, at the same time, with a 30‐minute sampling rate between data points for six 400‐hp, two‐stage, double‐acting, water‐cooled XLE compressors with 5‐step unloading (100%, 75%, 50%, 25%, and idle) over a 24‐hour period. Usually 3‐4 units run at any one time and they are set to load in sequentially. The scfm (flow) is calculated by the control monitoring system using the percent of time at load. With the 30‐minute intervals, the number of part load units on at any one time is not evident and you cannot see the various levels of unloading as a percent of full load of any unit. The cycling rate is much too fast for the sample rate.
The chart in Figure 5 is the same data, with a 5‐second sampling rate, over a 6‐hour period. Reviewing the curves produced by each of these during the same 6‐hour period reveals:
- The 5‐second data point chart clearly shows the 5‐step unloading for each applicable unit.
- The minimum calculated flow with the 30‐minute data points was 5,000 cfm. The more accurate minimum flow with the 5‐second data points was 6,000 cfm.
- The maximum flow calculated with the 30‐minute data point was 7,600 cfm for a very short duration. The maximum flow, using the 5‐second sampling rate, is 8,000 and occurs ten separate times during the six hours of logging and one time for over a 20‐minute sustained duration.
To conclude, the protocol to correctly identify input power (kW) and interpret the data per situation and to identify the air flow is correct. Proper implementation depends on personnel familiar with the specific air compressors and the operation of the specific capacity controls -along with the knowledge and experience to properly acquire and process the data.
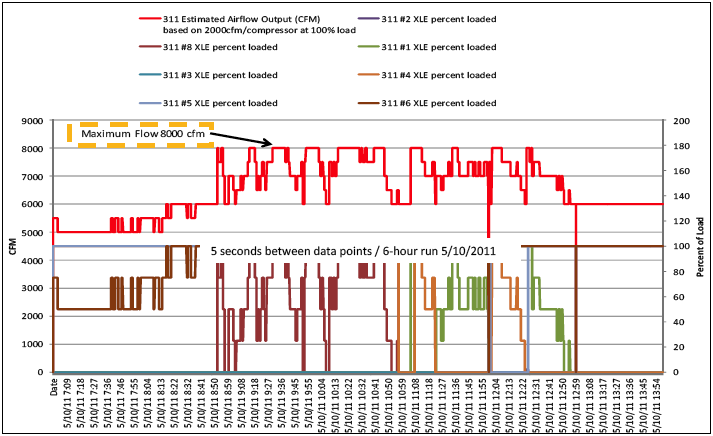
Figure 5. 5-second data sampling interval of six 400 hp air compressors shows different results.
Inerpreting Flow Meter Charts
As discussed, with kW measurement, it is important to be able to read all critical data to analyze what is or is not occurring. This is often dependent on data point times when logging data with trended measurement. The measurement interval can provide significantly different data when trying to determine maximum sustained peak flow ‐ i.e. any flow that will have to be supplied or the system will fall in pressure to ineffective levels. This is a function at peak flow, duration at peak and available effective storage. Care must be taken.
We provide an example of the same installation where we installed flow meters, during the system assessment, and created four flow charts with different measurement intervals.
- Flow Chart 1 (Figure 6) represented five days of measurement with data points plotted and averaged every 15 minutes. Conclusion: an average flow of 586 scfm at 92 psig. There are apparent short duration flow peaks up to about 900 scfm.
- Flow Chart 2 represented 16.5 hours of measurement with data points plotted and averaged every 5 seconds. Conclusion: an average flow of 618 scfm at 92 psig pressure. The pressure at one point is below 92 psig for over 6 hours out of the 16.5 hours. Furthermore, the pressure fell to below 85 psig for over 1 hour and below 90 psig for almost 5 hours. There are several sustained peak demands in this short time, one of which is 90 minutes long at or near 900 cfm.
- Flow Chart 3 represented 17 hours of measurement with data points plotted and averaged every 1 minute. Conclusion: an average flow of 536 scfm at 93 psig pressure.
- Flow Chart 4 (Figure 7) represented 2 hours of measurement with data points plotted and averaged every 5 seconds. Conclusion: an average flow of 630 scfm at 90 psig pressure.
After reviewing Flow Charts 1 through 4, this operating profile is now much more detailed. Enough time must be logged and plotted, even with flow meters, to allow not only these important pieces to become visible, but also to allow the profile to be compared to apparent demand activity and ensure the charts only reflect plant flow demand and not piping or external issues. Further observations made from Flow Chart 4 were:
- At 13:27 the pressure began to fall as the demand increased.
- By 13:20 (after 7 minutes) the pressure had fallen from 93 to almost 75 psig while the demand increased from about 615 scfm to almost 950 cfm.
- The flow demand stayed above 800 scfm for over 3 minutes.
- During this 24‐minute run the pressure never returned to 93 and generally was well below 90 psig.
- If production was not negatively affected by the sustained low pressure, for almost 24 minutes, then it may be most likely the plant can and could run at a lower pressure.
- It would be a good idea for plant personnel to identify this 300‐400 scfm event, particularly if it shows up in a continuing manner. Perhaps action can be taken to eliminate some of this and/or convert the peaks to low average flow by some ingenious use of storage. Flow chart 4 does not tell all, but it does identify probable areas of opportunity to be fully investigated.
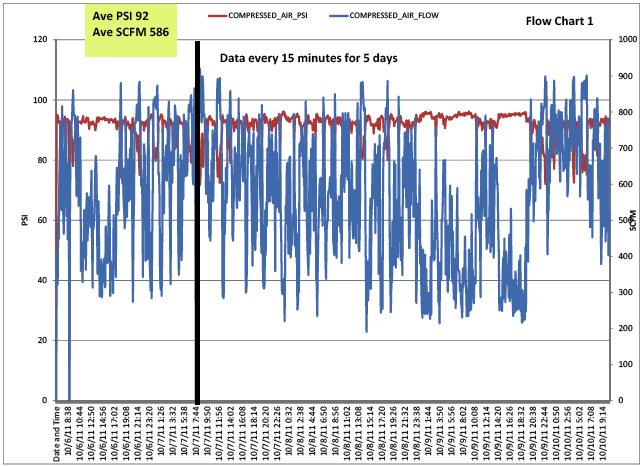
Figure 6. Flow Chart 1 represented an average flow of 586 scfm at 92 psig.
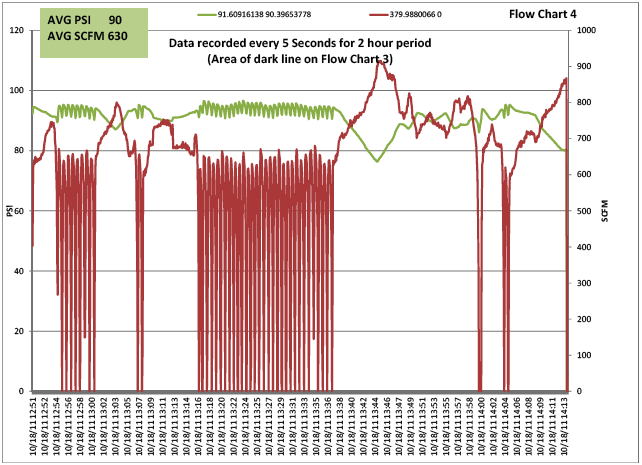
Figure 7. Flow Chart 4 represented an average flow of 630 scfm at 90 psig pressure.
Conclusion
The key to compressed air system measurement is to produce verifiable, repeatable and sustainable data and results that can not only be used to reduce energy costs but to sustain the savings. After a full audit is completed and implemented, establish an ongoing monitoring program that will allow the plant to maintain your optimized savings by:
- Tracking air system efficiency to maintain savings levels (“savings persistence”).
- Help identify energy projects and document savings to collect utility rebates.
- Troubleshoot, find and diagnose air system problems, leaks and bottlenecks.
- Allocate compressed air system costs at the department level based on consumption measurement for individual departments and at key points of use.
For more information please visit www.airpowerusainc.com.
To read similar System Assessment articles, please visit www.airbestpractices.com/system-assessments.


