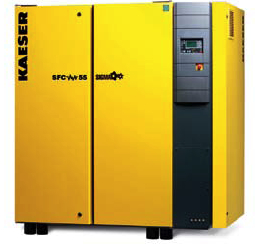
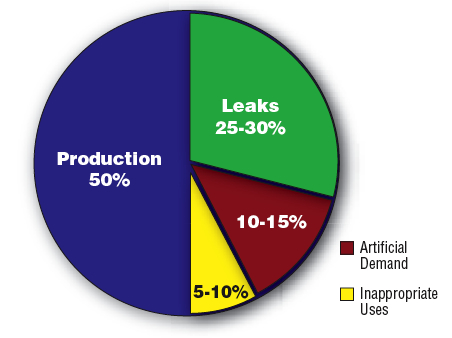
The U.S. Department of Energy estimates that air compressors use as much as 10% of all electricity generated in the United States. Further, the DOE calculates that as much as 50% of this energy is wasted. Compressed air leaks alone account for 25-30% of compressed air use.
Consequently, many industrial companies are identifying ways to lower their compressed air system energy consumption. One of the most popular methods to do so is a comprehensive compressed air audit, or “air demand analysis.” The objective of this paper is to define the five steps required in a compressed air audit. We will use a real-world example with system information from a magnetic materials manufacturer to clearly illustrate each step. In the following case, the user achieved a 42% reduction in annual energy costs.
Step 1: Conduct a Site Survey
It is important to list and understand all the equipment in a compressed air system before installing any measurement devices so that 1) the devices are properly placed, and 2) system dynamics are properly understood. The person responsible for collecting information should note: environmental conditions, physical layout, details on all air system components including clean air treatment, piping, storage and controls. Processes at the facility should also be documented. Many auditors will have a questionnaire which they will complete to compile the details into one document.
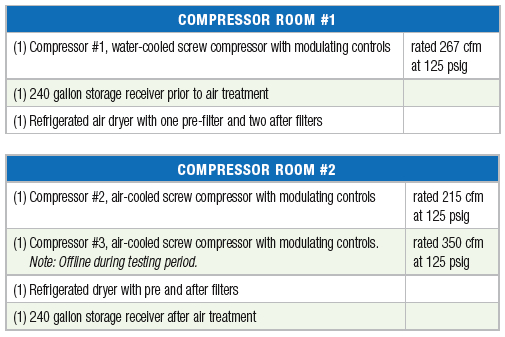
Case: This facility had two compressor rooms using rotary screw air compressors from three different manufacturers. They also had a mix of refrigerated air dryers, receiver tanks and filters. The piping network was made up of 1.25, 1.5 and 2 inch lines.
Both Compressor #1 and #2 were operating in modulation control. Compressor #3 was also using modulation control but was offline during the testing period.
Step 2: Measure and Quantify kW / 100 cfm
For many systems – power, flow, and pressure should be measured for a period of 10-days to obtain an accurate system snapshot (other data points such as pressure dew point [to determine air quality], vacuum, and temperature should be measured as needed based on system requirements). The measurement period should include nights, weekends or other downtime to identify non-productive demands. True power used by the air compressors is measured using kilowatt meters which would monitor amperage, voltage, and power factor. Data loggers should record data points on each air compressor every 0.5 seconds, and average the data over a preset recording interval such as 20-second resolution.
A suitable Key Performance Indicator (KPI) for all compressed air systems is specific power consumed (kW) per 100 cubic feet per minute (cfm) of compressed air used in the plant. This provides an idea of how efficient a compressed air system is – regardless of varying plant output levels. Recommended systems have a KPI below 21 kW / 100 cfm.
Case: Flow on Compressor #2 was measured by installing a vacuum transducer at the inlet of the air compressor. A vacuum transducer could not be installed on Compressor #1, so a flow meter was installed at the discharge of this system prior to the distribution piping. Pressure sensors were installed in both compressor rooms as well.
The measured specific power KPI (kW / 100 cfm) of the existing system was measured at almost 32 kW / 100 cfm. Based upon this there was reason to suspect significant energy cost savings potential.
Step 3: Understand the System Dynamics
The system information collected should be thoroughly analyzed and areas of improvement should be identified. Multiple scenarios should be considered to lower the compressed air system’s energy consumption, including an analysis of the major compressed air users within the facility to determine whether compressed air is the most efficient option for each application.
Case: The average compressed air supply was 240 cfm at the required plant pressure set point of 95 psig. The measured compressed air supply range was between 200 and 300 cfm.
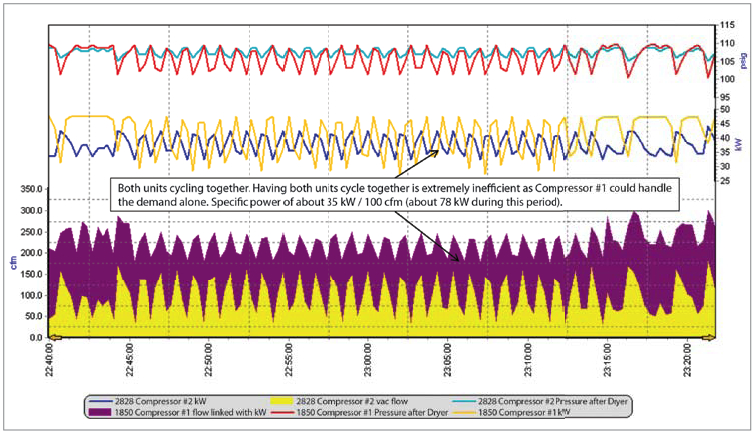
Most often, both Compressors #1 and #2 were loaded to maintain plant pressure. The available compressor supply significantly exceeded the
compressed air demand. Based on the measured flow profiles during the testing period, Compressor #1 was capable of meeting the average
demand without assistance from Compressor #2, but was not capable of meeting the peak demand. As shown in Figure 1, the two units were
running in modulation control, which partially opened or closed the compressor inlet valves -- creating vacuums at the inlets to match supply to demand. Due to the negative pressure at the inlet valves, the compression ratio was increased which increased the amount of power required per cubic foot of air to meet the set point pressure. Though the two compressors were maintaining a steady operating pressure, they required extremely high power consumption at partial loads thus creating the very inefficient Specific Power KPI of 35 kW/ 100 cfm.
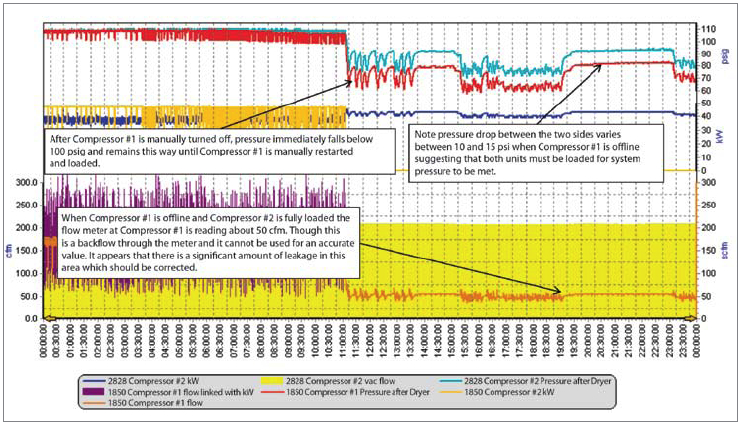
When Compressor #1 was either manually stopped, or when the unit experienced a failure, pressure in the facility dropped below the minimum required level of 95 psig. During these times the flow meter at Compressor #1 read an average of 50 cfm. This suggests that a significant portion of the air demand was air leakage. Figure 2 highlights one such day. This graphic also shows the significant pressure drop between the two compressor rooms when Compressor #1 was offline, between 10 psi and 15 psi. This suggests that the piping network (1.25, 1.5 and 2 inch) was insufficiently sized.
The air treatment equipment was working well and no issues were noted. The equipment was sized for worst-case ambient conditions which is a good practice.
Figure 1: Compressors #1 and #2 Running in Modulation Control
Step 4: Implement a Recommendation to Improve kW/100 cfm
 |
|
Without proper system control, the system’s overall energy consumption may not besignificantly lowered. |
|
Many system assessments focus on reducing compressed air consumption by fixing compressed air leaks or through the elimination of “inappropriate uses” of compressed air. Using engineered air nozzles, for example, to replace perforated pipe for blow-off applications will reduce compressed air demand. Real energy savings, however, will ONLY be realized if the controls on the air compressors can capitalize on these gains and when appropriate this includes proper use of a variable frequency drive (VFD). The costs involved with adjusting compressor controls are almost never included in the ROI calculations. Many modulating air compressors will continue to consume the same amount of electricity (kW) within broad ranges of compressed air flows (cfm). Users cannot assume a linear relationship between compressed air use and power consumption.
Case: The following recommendations were accepted and implemented:
- Installed a 55 kW VFD, air-cooled, rotary screw air compressor able to handle the full air load.
- Removed Compressor #3, but retained Compressors #1 and #2 for back-up.
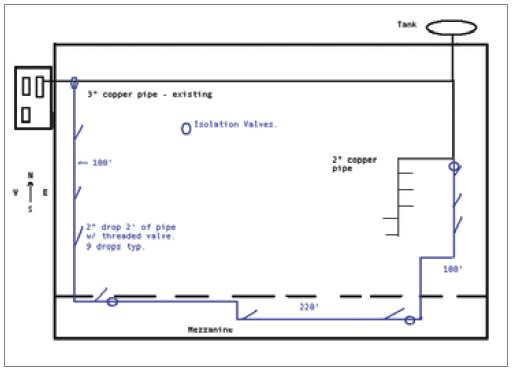
- Reconfigured the piping in the facility to eliminate pressure losses and air leaks.
- Increased storage with a 1040 gallon dry tank.
|
|
|
Installing a 55 kW VFD would result in an estimated 13.54 kW savings per 100 cfm. |
Figure 2: Compressor #1 Offline
 |
|
Without reconfiguring the compressed air piping (blue pipe in image), the facility
|
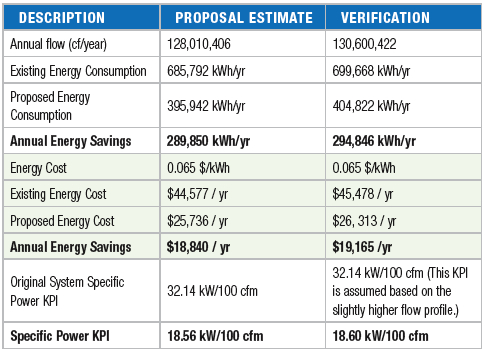
The piping was a critical component in the system’s optimization. Creating a closed loop allowed for the proper system pressure downstream, but required less work of the compressor. With the 55 kW unit capable of providing 389 cfm at 100 psig and sized to operate in its most efficient range between 40-85% load, the new specific power KPI was estimated to be 18.6 kW / 100 cfm. This KPI would meet the recommendation to be below 21 kW / 100 cfm, and represented a significant improvement over the existing systems’ specific power KPI of 32.14 kW/100 cfm.
Step 5: Verify Performance of kW/100 cfm
Utility rebate programs sometimes require energy savings be verified by an additional compressed air audit performed after the air system is optimized. In cases where utility rebates do not require such a degree of verification, facilities should still consider implementing some form of a post-optimization assessment. All systems can be enhanced – even systems designed using air audit data and that are newly installed. The additional assessment should verify the compressed air audit findings, as well as assist in identifying additional areas of improvement. Some system controllers actually track and store ongoing energy consumption data, so for many, a review with a master system controller provides enough information for internal evaluation and can be used to verify improvement metrics.
Case: A follow-up compressed air audit was performed for this manufacturer. The verification results showed that although the overall air demand in the factory had gone up (from 244 to 289 cfm), the 55 kW VFD efficiency was well within the target zone of 18.6 kW /100 cfm KPI. Average operating pressure had also been reduced by 3 psig. Eliminating the water-cooling requirement provided a bonus potential savings of \$1,208 per year (based upon \$0.20 per 1,000 gallons cost of cooling water). The annual energy savings were verified at \$19,165 per year – a whopping 42% reduction in energy cost and slightly higher than what was estimated.
Conclusion
It is critical to focus on improving the specific KPI of kW/100 cfm. Compressed air users can ensure return on investments (based upon energy savings) on air system audits by working with firms who measure at least power, flow, and pressure over a period long enough to obtain an accurate system snapshot, often 10 days. Further, the data obtained from the audit must be thoroughly analyzed and recommendations should be made based on conservative estimates of power reduction.
When implementing an optimization plan, it is important to remember that without proper system control, the system’s overall energy consumption may not be significantly lowered. In the case described, adding a VFD unit allowed the system to generate compressed air at the lowest acceptable pressure, thereby reducing energy consumption and cost. In many cases, a master system controller is the best solution as master controllers use compressors at their most efficient design point or turn them off.
Finally, users that complete a compressed air audit and optimize their systems will surely reduce energy consumption and see lower operating costs. However, even the best, newly optimized systems can always be further improved. Facilities should be advised that additional savings can be determined by completing a leak detection audit in conjunction with a full evaluation of the demand-side of the facility for appropriate use of compressed air. Facilities should determine which services are best suited for them (leak detection, supply-side compressed air audit, and/or demand-side compressed air audit), and develop a plan for how often those services should be performed.
For more information please contact Kaeser Compressors, tel: 877-586-2691, email: ada.us@kaeser.com, www.kaeser.com/ada.

