Compressed air leaks - every system has them. Is a leak identification and control program economically rewarding and/or necessary? Upper management sometimes doesn’t recognize the true cost of not repairing air leaks. Knowing the high cost of compressed air, why wouldn’t every facility with a compressed air piping system implement a continuous leak identification and repair program?
Accountability with Leak Values
Upper management sometimes doesn’t recognize the true cost of not repairing air leaks . How does this mindset happen? It happens because accurate values of compressed air leaks - as true air –use reductions and the accurate translation into lower energy costs create scenarios which, over the years, have lacked accountability. Often we do see a reduction in compressed air use, but there is little if any measured or perceived reduction in the electric bill. It is no small wonder that a financial officer can be skeptical of projected savings.
 |
||
|
MYTH: Leaks don’t really amount to much. FACT: In most plants, compressed air leaks are the single largest user. Plants with no effective compressed air leak management program lose up to 30% to 50% of their compressed air to leaks. MYTH: The system may be leaking some air but it doesn’t cost much. FACT: An air system with 300-hp of compressed air in use has approximately 100-hp in probable leaks. At a cost of \$.05/kWh electric rate, this is over \$35,000/year of wasted electrical energy or 1/3 of the power / energy used to produce compressed air. Formula: 100-hp x .746 x .05/kWh x 8760 hrs ˜ .93 ME |
Beware the cfm-to \$’s Estimate
When the technician is finding and tagging the compressed air leaks, he is also creating a “leak-list” and trying to estimate its value in cubic feet per minute (cfm) lost. Figure One reflects the amount of air that will blow through an orifice of a specific diameter at a specific backpressure. The most often quoted number is “…a 1/4” leak will pass 104 cfm at 100 psig”, which at \$100/per cfm, results in \$10,000/year in energy cost to produce.”
Figure 1. Perfect leak flow
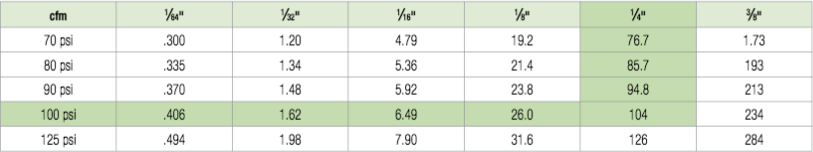
This chart is true. What is not said is that it is a test orifice of a given design and thickness with a specific “chamfer” to allow for free flow to a wide-open ambient. These statements are often used “for effect” but should not be used to try and estimate the volume. Clearly, none of these leaks are machined, round holes. Many follow a relatively long, tortuous path from the compressed air source to the ambient. As they travel the “restriction path”, the backpressure falls and lowers the volume of the leak. But it is still expensive.
In short, when someone says this volume of leaks (cfm) translates into a “savings” of \$40,000 per month, what they are really saying is, “…it costs you (the plant) \$40,000 per month in electrical energy use to produce, dry and distribute this volume (cfm) of air at this pressure (psig) - which is the air lost in these leaks”.
Repairing all these compressed air leaks will not reduce the electric bill by the full cost - unless the amount removed allowed the complete removal of one air compressor that was at full load and now was no longer needed.
The actual amount of “recoverable electrical energy” is a function of the type of air compressor and the local capacity controls. This recoverable energy cost can vary from 0% to as good as 95% or more.
This is by far the most complicated part of the process for an inexperienced compressed air consultant or auditor not fully trained in all types of compressors and their available capacity control. The capacity control or unloading control is the key element to convert lower air usage by volume into a predictable lower level input power or energy. A well-designed central air management control system can often increase this recovery process and/or stabilize the operation and flag when maintenance attention is required.
The actual amount of “recoverable electrical energy” is a function of the type of compressor and the local capacity controls. This recoverable energy cost can vary from 0% to as good as 95% or more.
For example, with a system using full blow off controls, such as centrifugals, or some oil-free rotary screw (the excess air produced is “blown”) and the load on the primary compressor stays constant – lowering the demand may just increase the blow off – the energy bill will remain the same.
On the other hand, a system where the “trim compressed air supply” is anchored by well applied, multi-step, variable displacement, variable speed or inlet guide vanes on the proper compressor in the proper load range can translate this lower volume of compressed air usage in almost a commensurate percentage lower input energy.
This becomes quite complicated for the uninformed, particularly when there are multiple units.
Consider the following data. Table 1 reflects the variance in plant load performance of a representative single-stage, lubricant-cooled, rotary screw compressor with the four most common, commercial capacity control systems available.
Table 1. Key air system characteristics - Current system*
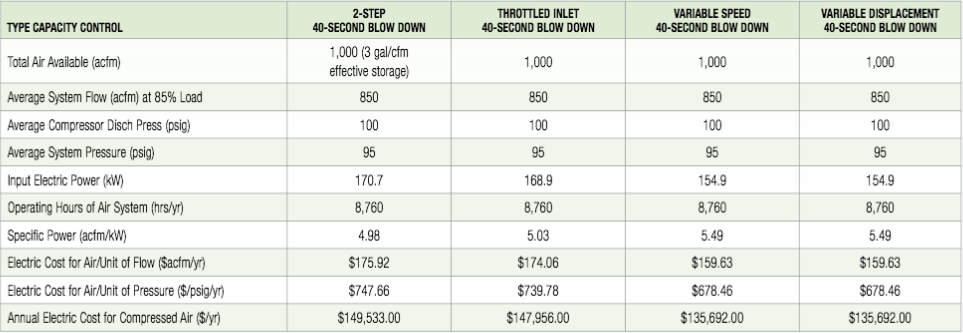
*Based upon on a blended electric rate of \$0.10 per kWh and 8,760 hours/year. Basic unit: 200 hp class/1,000 acfm at 220 bhp at 100 psig or (220 x .756 x .93 ME) = 176 kW input.
Table 2. Compressor User Profile - Current System
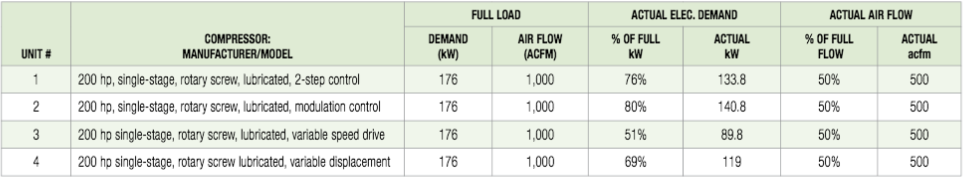
Performance data extrapolated from the DOE/CAC published capacity control performance curves with average lubricant-cooled, rotary screw compressor and 40-second blow down.
This article observes one type of compressor against five to six other types commonly used for this size industrial air supply:
Analyzing the relative results of four different types of capacity control systems on this class unit:
- At 85% flow, the overall specific power only varies by somewhat less than 10% from the highest to the lowest.
- Move the demand to 50% and this variance is now almost 37%.
- 85% demand is somewhat more efficient than the 2-step unit with 3-gallon/cfm effective storage and the variable speed drive and variable displacement controls are almost 10% more efficient.
- At 50% demand, the 2-step control unit is 4% more efficient than modulation (6.2 kW). The variable speed drive is 37% more efficient than the modulation and over 25% more efficient than the variable displacement unit.
- There are other units, other capacity controls. Capacity controls performance can be significantly reduced by poor piping practice, lack of effective storage, etc.
- The real cost is how many hours the compressor operates at each condition.
|
||
| The actual amount of “recoverable electrical energy” is a function of the type of compressor and the local capacity controls. This recoverable energy cost can vary from 0% to as good as 95% or more. |
Summary
This article is not an attempt to fully discuss air compressor capacity controls - but it is this widely varying performance that affects one’s ability to successfully predict the input energy (kWh) reduction created by the repair of a certain quantity (cfm) of leaks.
Generally, if you calculate what energy is used to produce the air that leaks, you will not be able to recover all of this energy at part load performance unless you shut off a complete unit in some cases.
This is a relatively complicated process and should be implemented by knowledgeable personnel familiar with all the basic operating characteristics and the dynamics of the particular system as installed and operating. Any projected improvements in these operating parameters must be factored in.
Once correctly set up, a very accurate \$acfm/yr value can be assigned to each leak repaired that will predict dollar recovery value for each acfm saved.
The reports to management will then reflect predictable returns that will show up as advertised and more support will be forthcoming.
Now you have myth vs. fact on compressed air leaks.
For more information please contact Hank Van Ormer, Air Power USA, Tel: 740-862-4112, www.airpowerusainc.com.