The efficiency of a compressed air system is typically assessed across three main sectors: the compressor room, the main distribution network and point-of-use service drops. Each of these segments offers numerous energy-saving strategies and proper installation practices.
In recent times, the significance of material quality used within air compressor rooms and main distribution networks has been increasingly recognized, leading to advancements in energy conservation within these pivotal sectors. However, this focus on material enhancements has not always translated to the last 30 feet of the compressed air system, an area notorious for its loss in efficiency. Here, 30 to 40% of a compressed air system's total energy losses can occur.
To address inefficiencies at service drops, one must first understand what a pressure drop entails. A pressure drop is the reduction in compressed air pressure from the air compressor output to the final application. System leaks diminish air pressure, causing the air compressor to exert extra effort to maintain the required pressure. Leaks also disrupt airflow patterns, creating turbulence that increases friction and reduces airspeed. Proper management of leaks can offer substantial annual savings in compressed air consumption. Cumulative minor pressure losses within the compressed air distribution network may result in significant pressure reduction, compelling the entire system to operate at elevated pressures to deliver the necessary pressure to end-users. For instance, a tool requiring 100 psi that experiences a 30 psi pressure drop would require the air compressor to operate at 130 psi, drastically increasing energy consumption and costs.
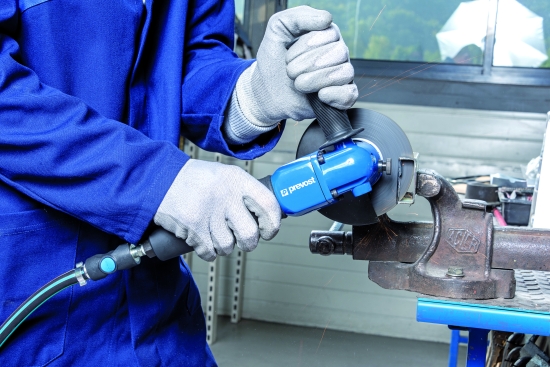
A technician using a pneumatic tool for precise metalwork.
“The Dirty 30”: Common Problems in the Last 30 Feet of Piping
Turning our focus to the final section of the compressed air system – the point closest to consumption and use – the following factors are crucial for improving efficiency: minimizing pressure drops and leakages, ensuring overall safety, reducing maintenance costs, identifying potential issues and hazards, enhancing worker efficiency and guaranteeing air quality and energy conservation. The primary contributors to energy loss within the last 30 feet of the compressed air system can be attributed to four key areas: piping materials, sizing, threaded junctions and end-use materials.
The choice of piping materials for the final sections of the compressed air network, such as service drops, is paramount. Using outdated materials can lead to corrosion and, as a result, disrupt laminar airflow, causing substantial pressure drops, leakages and air contamination. Specifically, corrosion can exacerbate the inner surface of the compressed air pipes, impeding airflow and increasing leak incidence. Selecting materials that resist corrosion and leakage is crucial for maintaining unobstructed airflow. Moreover, mitigating moisture is vital, as excessive moisture in compressed air pipes can cause corrosion, particularly in vulnerable materials.
A good starting point to calculate the pressure drop linked to different materials is understanding the Absolute Roughness Coefficient of the materials used. Some examples are in Table 1.
|
Surface Material |
Absolute Roughness Coefficient - ε in (feet) |
|
Aluminum |
3.3 10-6 |
|
Stainless steel |
5 10-5 |
|
Steel commercial pipe |
1.5 10-5 |
|
Welded steel |
1.5 10-5 |
|
Galvanized steel |
5 10-4 |
|
Rusted steel |
5 - 133 10-4 |
Table 1. The Absolute Roughness Coefficient of common materials in compressed air piping.
The friction caused by different piping surfaces generates turbulence and pressure drop. Consider a short drop pipe (30 feet) with a diameter of 1 inch working at a pressure of 116 psi and transporting approximately 88 scfm. If the material has a minimum roughness of aluminum (which has an Absolute Roughness Coefficient of ε= 3.3 10-6 feet), the pressure drop will be approximately 1.02 psi (below 1%). If the material roughness is rusted steel, the pressure drop will be more than double (between 2.4 and 5 psi).
Industrial plants losing a lot of pressure in their compressed air systems need to raise their overall pressure to compensate. The rule of thumb is every extra 2 psi adds about 1% to the compressed air system’s energy costs. Consider the costs of a 20 horsepower (hp) air compressor for the last 30 feet of a compressed air system. Energy costs for 24/7 operation can be around \$13,000 to \$15,000 per year (at \$0.10/kWh). A 1 to 2% increase in energy use would add another \$150 to \$300 per year to the energy bill only for one 30-foot span with a high Absolute Roughness Coefficient.
Simplify Piping Configurations
Correct sizing and configuration in a compressed air system are also critical. Inaccuracies in sizing can induce velocity increases or turbulence, resulting in pressure drops. Similarly, a poorly conceived compressed air distribution system with lengthy runs from the air compressor to the application point can cause friction losses and, with multiple connections, significant pressure drops. Simplifying the compressed air network with fewer drops and bends will help alleviate these issues.
For example, taking the previous example (a 30-foot drop using 1-inch piping, a pressure of 116 psi and 88 scfm), the installation without connections has a pressure drop around 1.02 psi. If the same system includes five elbows, one nipple, one valve and a manifold, pressure drop doubles to around 2 psi. The cost per year from the pressure drops alone could be around \$150 to \$300.
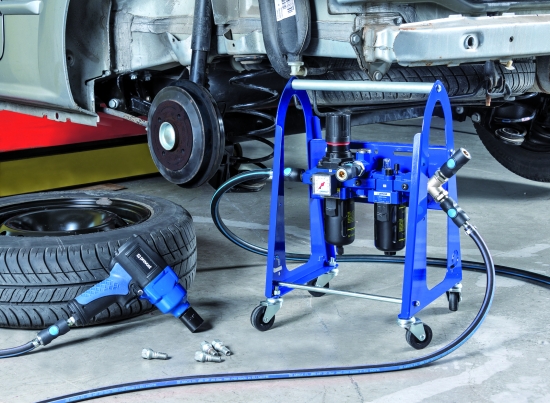
This air treatment unit is on a gantry for easy portability.
Check Piping System Connections
All the threaded junctions in a compressed air system (especially in the last 30 feet) that aren’t well connected are potential leak areas, due to contractions, expansions and vibrations (all of which are normal in the life of a compressed air system). This problem is especially great in older compressed air piping networks.
Consider a 30-foot rusted steel pipe system with three to four threaded junctions which cause 1/32-inch diameter leakages. Calculate the total leak cost for the previous example with this formula:
Compressed air leak cost = # of leaks x leakage rate (cfm) x kW/cfm x # of hours x \$/kWh
Cost from 1/32” leaks = 2 x 1.55 x 0.61 x 0.17 x 8760 x 0.1 = \$462.89
Component Leaks Can Add Up
Selecting high-quality end-use materials for push fittings, filters, tools and quick couplings is critical to compressed air system efficiency. Over their lifespan, these components accumulate several leaks that drastically affect compressed air system performance. For pipes and fittings, a smooth and consistent flow is best maintained by using corrosion-resistant and leak-proof materials.
These components add pressure drops or leakages according to their quality or mounting type, reaching up to 10 to 20% of compressed air lost. In our example, the cost for energy loss per year could be around \$1,300 to \$2,000 or more.
All in all, a 20 hp air compressor with energy consumption between \$13,000 to \$15,000 per year providing compressed air to 30 feet of rusted steel pipe with low-quality materials could have the following costs:
Pressure drop linked to materials: \$150 to \$300 per year
Wrong size and configuration: \$150 to \$300 per year
Leakages in pipe junctions: \$200 to \$500 per year
Poor end-use materials: \$1,300 to \$2,600 per year
Total: \$1,800 to \$3,700 per year
That figure represents 20 to 30% of the air compressor’s total energy consumption.
Introducing the Prevost PPS AMS
To simplify monitoring in the last 30 feet of a compressed air system, Prevost is introducing the PPS AMS (which stands for Prevost Piping System Air Monitoring System).
This system uses automatic valves and sensors to ensure compressed air piping networks operate as they should. It monitors and calculates energy savings and leakage costs.
Valves and sensors are installed at each compressed air piping drop and can be remotely monitored, allowing users to not only have useful KPIs and statistics on hand, but also manage valves (with manual, automatic and timer settings) and set parameters with minimum and maximum values (including temperature and pressure).
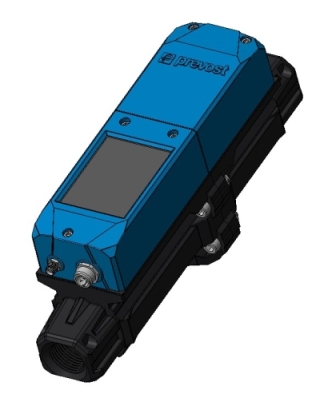
A rendering of the Prevost PPS AMS.
The system’s monitoring offers detailed information to better control the final 30 feet of every installation, including precise leak detection, leak cost calculations, safety alerts, minimum and maximum pressure and temperature readings, costs for the full compressed air system and cost savings.
In an emergency, owners can use the PPS AMS to automatically open or close the compressed air flow, helping avoid damages or compressed air losses.
Users can view data on leak detection (volume and energy costs), flow (volume and energy costs), pressure, dew point, valve functioning and fluid controls. Data can be transmitted by Bluetooth or Io-Link, or output to a spreadsheet. This allows the owner to make reports and study trends.
The system’s alarms notify users when flow, pressure, dew point or temperature go outside set ranges. Additionally, the system monitors for even minute leaks and calculates estimated energy costs for them.
These features make it an ideal add-on for any compressed air network. It not only reduces leaks and saves on energy costs, but also helps plants operate more sustainably.

Carlo Gatti, Product Manager, Prevost.
About the Author
Carlo Gatti has worked in the compressed air market for 24 years. His professional activities have focused on the design, production and management of technical products for fluids under pressure to generate, control and transmit power in industry.

Prevost headquarters in Annecy-le-Vieux, France.
About Prevost
Prevost designs, develops, manufactures and markets a complete range of products for the distribution of compressed air including networks with safety fittings, filtration solutions and pneumatic equipment. For more information, visit https://www.prevostusa.com.
To read more Compressed Air Piping System articles, visit https://www.airbestpractices.com/system-assessments/piping-storage.
Visit our Webinar Archives to listen to expert presentations on Compressed Air Piping Systems at https://www.airbestpractices.com/webinars.