Compressed air system performance data and proper interpretation is required in order to:
- Compare accurately to equipment OEM data sheet performance
- Establish an accurate performance baseline
- Measure the impact of system changes to compare with past compressed air system performance and efficiency
This article is a follow-up to a similar topic, covered in the October 2022 Issue of Compressed Air Best Practice Magazine, titled “What is CFM in Compressed Air? How Much Do I Have? How Much Do I Need?” This article dealt with all the various conditions that can and do affect the performance capacity of various types of air compressors in actual flow capacity (SCFM at site conditions).
For those of you that don’t remember exactly what was in the article, there were several significant take-aways.
- Any change in actual inlet pressure to the air compressor will affect the delivered volume and ability to perform work.
- The higher the inlet pressure in PSIA, the higher the rated flow. The appropriate mathematical equations are included.
- ACFM is actual delivered air at ambient conditions.
- SCFM is mathematically converted from ACFM to allow for differences in flow with actual measured conditions – compared to the OEM data and its rated conditions. It is a misconception that all SCFM ratings are equal! This is true only if the test rated conditions of the inlet pressures, inlet temperature and relative humidity are equal at the operating site. The article goes on to show various accurate methods to reconcile the differences.
This article’s emphasis is to establish a similar protocol for energy data measurement, particularly the HP and KW used to produce compressed air. When properly combined, with an accurate ACFM to SCFM reconciliation, this will deliver a good portrait of air compressor energy efficiency in KW/SCFM and with KWH the energy that creates the energy cost in SCFM
A few definitions are in order:
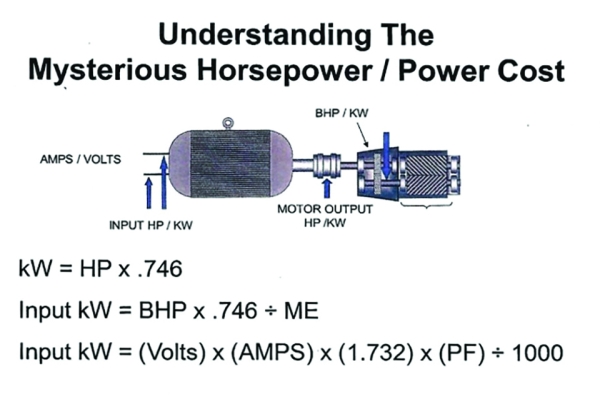
BHP – You often see BHP in OEM reference sheets. This is the power required at the air compressor drive shaft (often tested at the facility). It does not include any drive motor and power train losses such as Motor Efficiency (ME), Power Factor (PF), VSD Drive loss and belt or gear loss. All of this data must be considered to identify an answer that is not just data but information one can act on.
Primary Points of BHP at the air compressor (power required at the compressor shaft).
- Motor output HP may be same as BHP, or not
- Probable losses: VSD, gears, PF, ME
- Input HP/KW is what counts to create your energy bill.
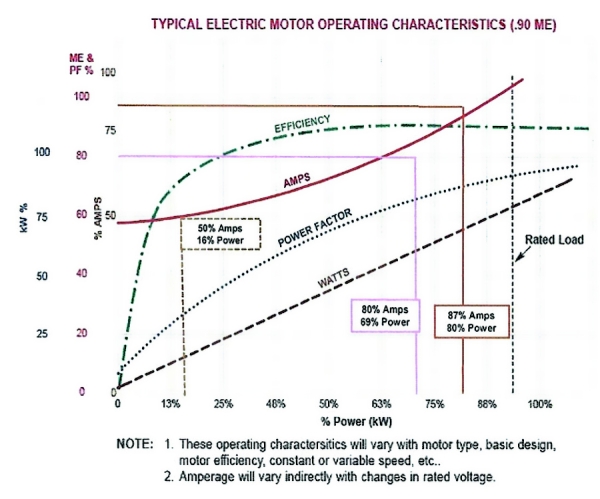
- Power factor and motor efficiency fall as the load falls from full to part to idle.
- Motor efficiency and power factor may both be affected by electrical motor speed changes.
Figure 1

Amp Measurement
Do not use percent of full load amps to identify the probable inlet power (KW) at part load. You will see that both the Motor Efficiency Curve and Power Factor Curve fall as the load falls (See Figure 2).To be meaningful, amps must be measured simultaneously with voltage. As the voltage varies the amps vary indirectly. As the voltage falls, the amps go up – with no load change.
When these operating curves in Figure 2 for the specific motor drive are available, they will allow a relatively accurate estimate of the amps to KW relationship. This is the design input KW at rated load when this specific motor and electric system are correct at rated speed. Speed variation will probably modify these curves.
Figure 2

How do we measure this data so it becomes useful information? The most accurate way to measure input KW is with meters on the motor and each leg that record amps, volts & PF simultaneously. The formula for this is (only applies to three phase power):
Input KW = (volts) x (amps) x (1.732) x PF ÷ 1000 (1.732 = ²√3ph)
The Data Point Spacing should be aligned with any collected flow & pressure data points to reflect an accurate profile.
It is important to remember Amps alone do not accurately reflect input power. It is input KW that generates the energy cost (KWH). In addition, KW properly measured is “a great tattle-tale” for maintenance.
An Example: Comparing Two Air Compressors
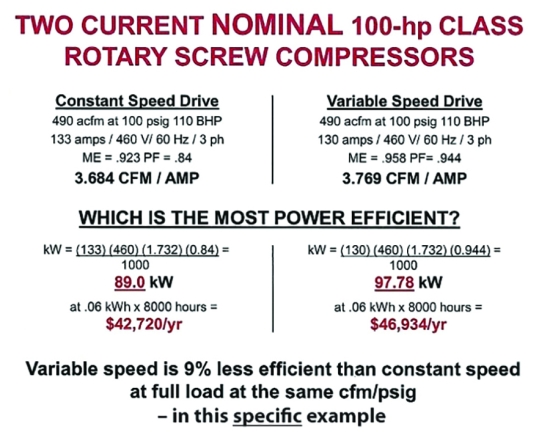
Here is an example. Two current nominal 100 HP single-stage, lubricant-cooled, rotary screw air compressors with the same full load pressure and flow ratings.
1 fixed speed air compressor – 133 amps
1 VSD Drive air compressor – 130 amps
Note that Amps are not proportional to power and that Amps, when measured without simultaneously voltage measurement, are meaningless. Which air compressor is the most efficient (in Figure 3)? Note the effect of power factor.
Figure 3

Measuring Input KW for Trouble-Shooting
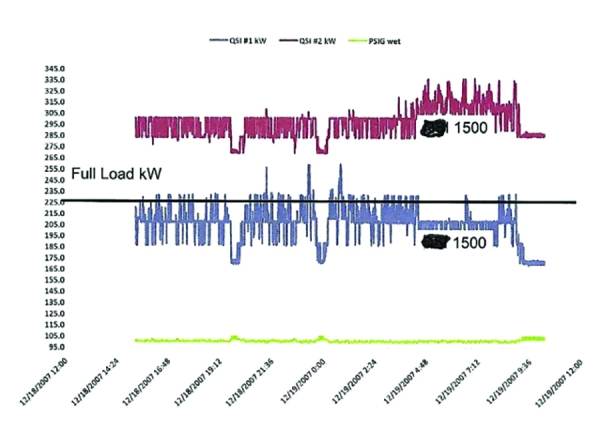
Figure 4 shows how properly measured and monitored input KW is a very effective trouble-shooting tactic. The KW curves shown in Figure 4 are for two identical 300 HP class single-stage, lubricant cooled, rotary screw air compressors installed next to each other. Their full load rated input KW at 100 psig was 225 KW. In actuality, the second unit used 285 to 325 KW, about 100KW extra, and ran like this for seven (7) years. This added up to $48,000 per year ($336,000 over 7 years) in additional electrical energy costs.
Figure 4

Click to enlarge.
There are many things that could have been the root cause of this situation: motor rewinds, starter/disconnect issue (this turned out to be the cause), connected wiring, mechanical or hydraulic issues. If input KW had been measured and monitored, the issue would have been identified much sooner.
We strongly recommend that all larger compressed air system consider installing a proper KW measurement / monitoring system, along with any other key performance indicators.
For more information on APenergy visit apenergy.com or call 740.862.4112
To read similar Air Compressor Technology articles, visit https://airbestpractices.com/technology/air-compressors.
Visit our Webinar Archives to listen to expert presentations on Air Compressor Technology at
https://www.airbestpractices.com/webinars.


