Do you know and track the annual generated nitrogen energy cost per SCFM? Do you know what factors drive this value and what action you can take to control the optimum lower levels?
APenergy often finds on-site nitrogen generators included in the plant compressed air system reviews and audits we perform. As these facilities-based nitrogen generators have become more and more popular, we have also noticed a very significant lack of fundamental knowledge of the true relationship of the energy cost per scfm/cf of compressed air and the energy cost per scfm/yr of nitrogen.
We have found that often the thought is that a little extra percent increase in nitrogen purity is a good step.
This can be a very expensive decision unless you have an accurate energy cost of the compressed air supply and subsequently the resulting energy cost of the nitrogen. This article identifies the increased energy cost in compressed air required as the purity level goes up and how the generated nitrogen volume drops. It will focus, most importantly, on the actual energy dollars per scfm/year of the generated nitrogen.
Some Basic Key Points to Consider
- The energy cost per scfm of the nitrogen is directly driven by the energy cost to produce the compressed air to deliver the nitrogen at the required purity level consistently.
- Identifying the correct purity level and controlling the level is absolutely critical to control the energy cost to operate the nitrogen system.
- Do you know the actual energy cost of the dry compressed air in either a dedicated nitrogen supply or from the facilities central compressed air supply? If not you cannot identify the nitrogen energy cost.
- We have audited literally thousands of compressed air systems over the years. Very few knew their energy cost/scfm/year until they reviewed our report.
- In this article we intend to illustrate the magnitude of potential wasted energy dollars when the compressed air system and the on-site nitrogen generation system are not properly monitored and controlled.
Two types of Nitrogen Generators: PSA (Pressure Swing Adsorption) and Selective Membrane Separation
PSA sends the compressed air through two storage tanks, filled with carbon molecular sieve (cms). This material traps the oxygen on its surface and allows the nitrogen to go to the using process:
PSA units have a capture cycle and a purge cycle to clear the bed. When this occurs, the compressed air is redirected to the second tower for the adsorption to continue uninterrupted. (See Fig. 1 & 2 for basic installation guidance).
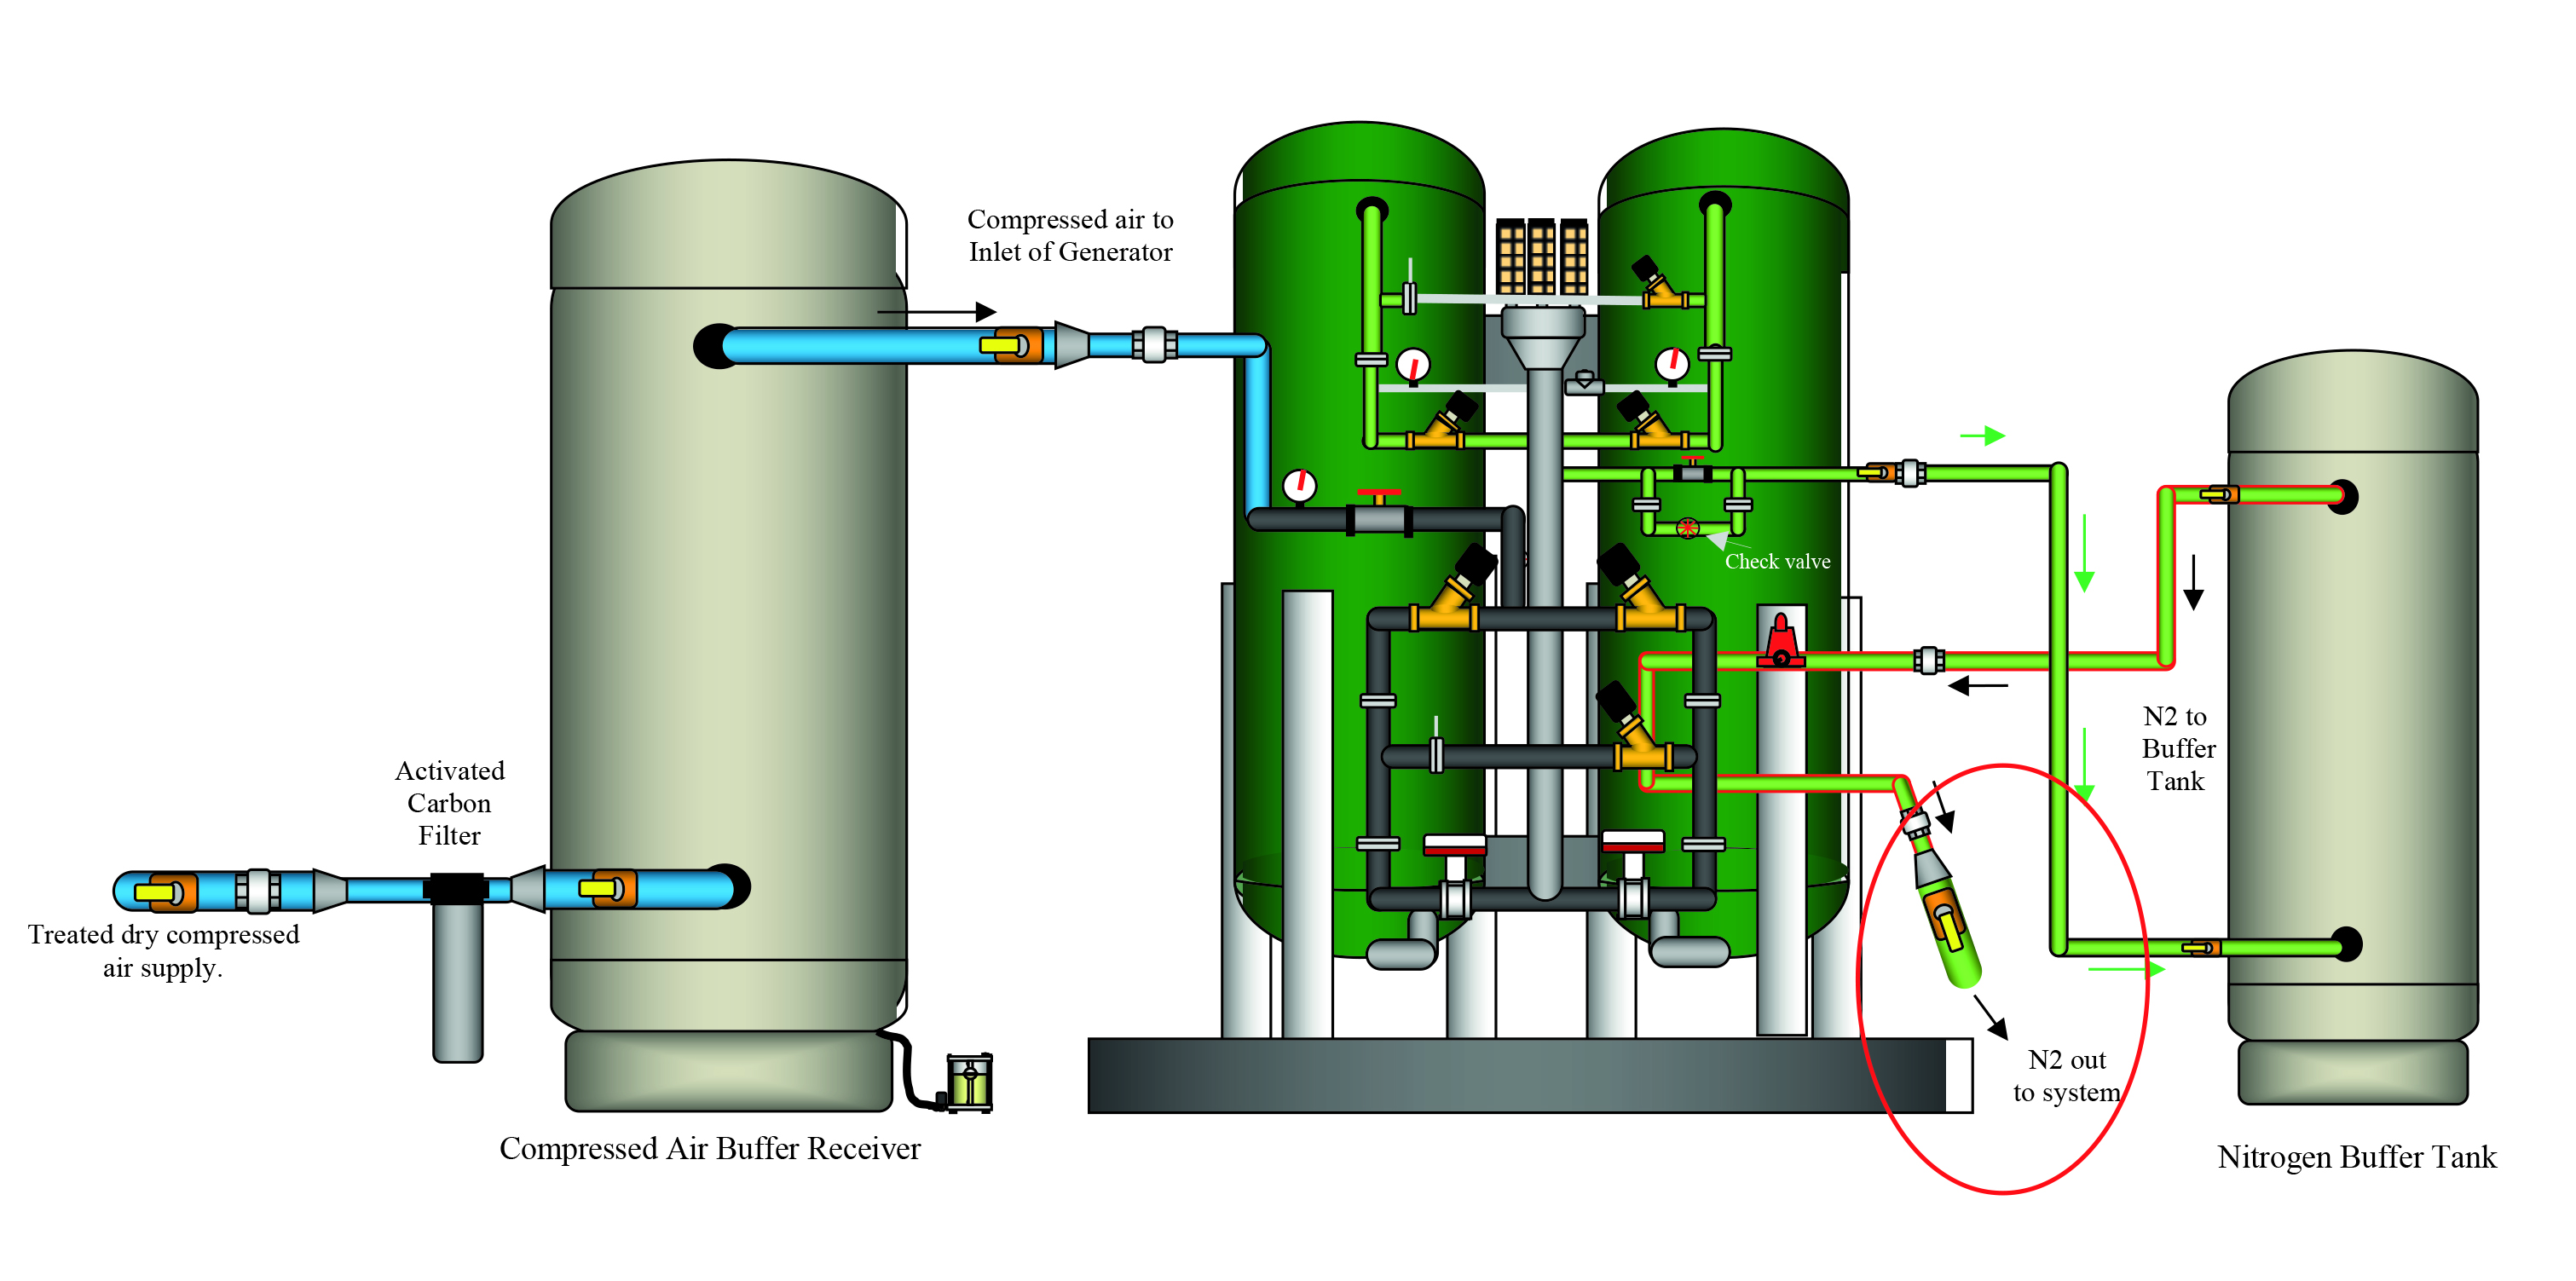
Figure 1. Typical PSA Installation with Lubricated Dry Air from a Central Air Supply. Click to enlarge.
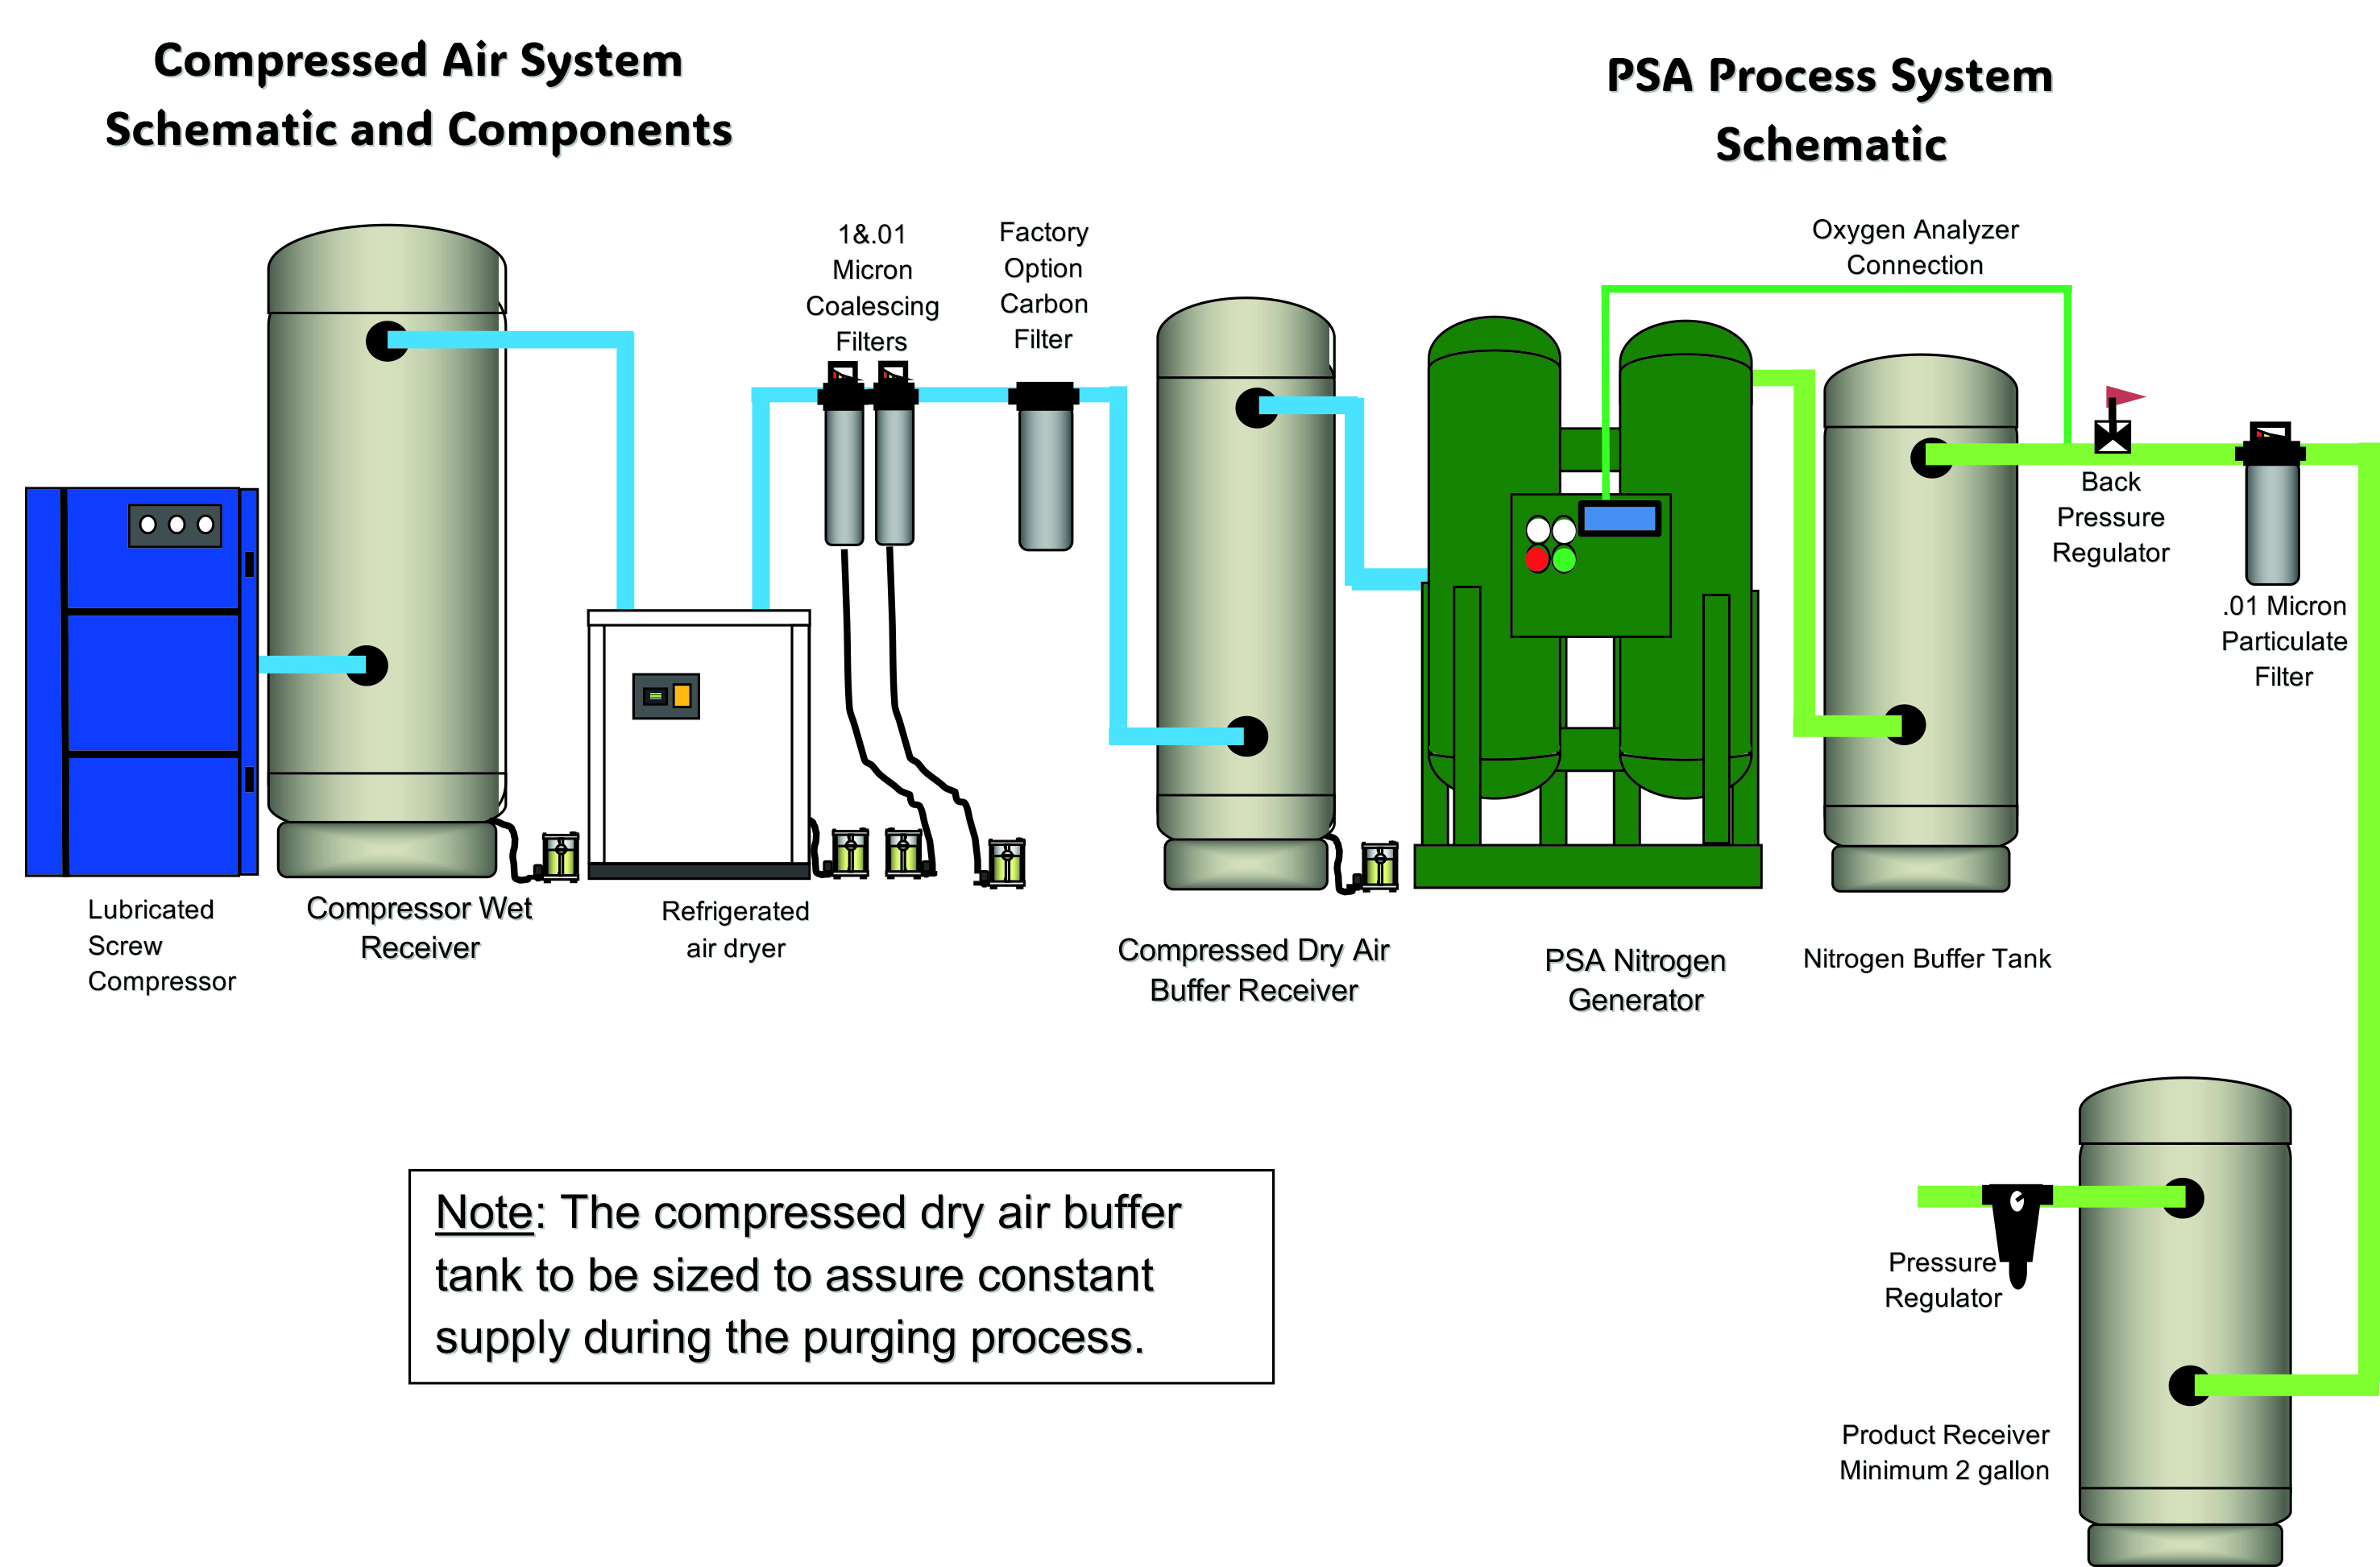
Figure 2. Typical PSA Installation with a Dedicated Lubricated Compressor and Refrigerated Air Dryer. Click to enlarge.
Membrane Separation uses a selective membrane to remove the oxygen only from the compressed air stream, thus flowing the nitrogen to the system. It is a constant flow of compressed air and nitrogen.
As we go into some of the production and efficiency performance in general for both types, we will call these guidelines as “typical” and for “exact” performance contact the manufacturer. What we hope to do here is show the reader the process and basic performance indicators – to guide you to proper action and questions.
PSA units are generally applied for nitrogen at higher volumes and/or higher purity levels when required. Selective membrane units are generally selected for lower Nitrogen volumes and lower purity levels.
Rules to Remember
There are several cardinal rules for both types of systems.
- Before you select and operate, identify the minimum required nitrogen purity required (% of nitrogen).
- Control and monitor that the process remains at the specified nitrogen purity. Controls are available on most quality generator units.
- Don’t raise the nitrogen purity unless you know the impact on the energy cost of (compressed air usage) and feel it’s worth it.
We have calculated a sample energy cost of compressed air produced by a single stage, lubricant cooled, rotary screw compressor 200 horsepower air compressor: capacity 1000 cfm; BHP 220; ME - .96, Motor input HP – 230 HP x .746 = 182kw – 5 days a week, 24 hours a day – 6240 hr/yr.
- Energy cost at \$0.10/kwh =182kw x .10 x 6240 ÷ 1000 = \$113.48/cfm/yr. Take that to \$114scfm/yr for dry air, this is a very conservative value.
Changes in the Electric Energy Rate (kwh) and operating hours will change the value proportionately. Other things that affect the compressed air supply electric cost scfm/year are type of compressor, type of capacity control as applied, effective storage, piping size and configuration, etc.
The following Tables 1 & 2 may surprise you:
|
Table 1: Typical values for estimating the effect on Nitrogen Production Energy annual cost when increasing the inlet pressure to a PSA Nitrogen Generator to raise the purity level |
||||
|
Dry CA Inlet Pressure |
Nitrogen Purity Level |
scfm CA Delivered \$/scfm/yr |
Recovered Nitrogen scfm |
Energy Cost scfm/yr N2 |
|
90 psig
|
95% |
2 scfm \$228.00 |
1 scfm N2 |
\$ 228 scfm/yr N2 |
|
100 psig
|
97% |
4.1 scfm \$467.40 |
.8 scfm N2 |
\$ 584 scfm/yr N2 |
|
110 psig
|
99.4% |
7.1 scfm \$809.40 |
.56 scfm N2 |
\$ 1445 scfm/yr N2 |
|
120 psig
|
99.9% |
8.8 scfm 1003.20 |
.47 scfm N2 |
\$ 2134 scfm/yr N2 |
|
130 psig
|
99.99% |
10.5 scfm \$1197.00 |
.38 scfm N2 |
\$ 3150 scfm/yr N2 |
|
140 psig
|
99.999% |
20 scfm \$2280.00 |
.23 scfm N2 |
\$ 9913 scfm/yr N2 |
- These costs are based on the compressed air supply delivering compressed air at 100 psig discharge pressure (\$114/scfm/yr). Each psig above that will increase the input power to a “Positive Displacement” air compressor – about 2 % per psig (i.e.: 10 psig higher will raise the input power to the air compressor about 5%). For other types of air compressors contact the OEM.
- Inlet Temperature To The Generator – these ratings are based on inlet air temperature of the DRY compressed air about 55°F to 70°F. At higher temperatures over the 70-75°F level, the nitrogen recovery value will start to deteriorate.
- Note that as the inlet pressure to the N2 generator goes up, so does the compressed air used. Worse, the recovery value (of nitrogen) falls significantly. The referenced pressure range of 90 psig to 140 psig is relatively common. The net result is at 95% purity, energy cost is \$228 scfm/yr. for nitrogen. When the purity level is 99.999% this becomes \$9,913 scfm/yr. for nitrogen! These ratios reflect a general performance curve for specific units on site. For precise numbers contact the OEMs to get specific answers to your questions.
|
Table 2: Nitrogen Outlet Flows at Different Purity Levels and Inlet Compressed Air Pressures to a Specific Selective Membrane Generators
|
||||||||
|
COMPRESSED AIR |
100 PSIG INLET PRESSURE |
145 PSIG INLET PRESSURE INCREASED FIXED FLOW |
||||||
|
NI Purity
|
95.0% |
97.0% |
99.0% |
99.5% |
95.0% |
97.0% |
99.0% |
99.5% |
|
Model 1 Scfm N2
|
11.6 |
7.6 |
3.6 |
2.5 |
19.6 |
13.0 |
6.6 |
4.6 |
|
Model 2 Scfm N2
|
17.7 |
11.7 |
5.6 |
4.0 |
29.5 |
19.8 |
10.1 |
7.2 |
|
Model 3 Scfm N2
|
24.6 |
16.4 |
8.2 |
5.9 |
40.5 |
27.4 |
14.3 |
9.5 |
|
Model 4 Scfm N2
|
35.9 |
24.0 |
12.1 |
8.4 |
59.2 |
40.1 |
21.0 |
14.2 |
|
Model 5 Scfm N2
|
57.5 |
38.4 |
19.3 |
13.7 |
94.7 |
64.1 |
33.5 |
22.8 |
|
Model 6 Scfm N2
|
80.3 |
53.8 |
27.0 |
19.0 |
132.4 |
89.7 |
46.9 |
33.7 |
|
Model 7 Scfm N2
|
229.6 |
153.5 |
76.7 |
55.0 |
378.4 |
256.1 |
133.5 |
94.9 |
|
Model 8 Scfm N2
|
287.7 |
192.2 |
95.6 |
70.1 |
474.2 |
320.8 |
156.7 |
119.7 |
Comments
- Each model number is a fixed volume of compressed air going through a specific membrane nitrogen generator. The 145 psig fixed volume is greater than the 100 psig. Note: As you raise the pressure, the volume of compressed air required goes up –the recovered nitrogen goes down as the purity level increases. Similar to the PSA generator shown in table one.
- For specific data on specific membrane nitrogen generators contact the manufacturer.
- Typical membrane generators may increase the recovered nitrogen 55% to 60% or more depending on operating conditions. This may increase the compressed air required up to 45% to 50% more. For accuracy contact the equipment manufacturer.
- Inlet compressed air temperature has the opposite effect on performance in selective membrane generators than with PSA units. As the inlet temperature increases, the recovery will improve while colder inlet temperatures have a negative impact.
-
Most manufacturers basic performance data is based on 75°F ambient and 75°F inlet temperature to the nitrogen generators. Most refrigerated dryers can deliver 75°F compressed air. Normal generator operating ranges are usually 50°F to 120°F. In the case of membrane separation, you should check with the OEM for what impact your proposed and actual operating temperatures will have on the life and performance of the membrane fibers. There are special fibers available for many extreme conditions.
Primary Take-Aways
- Know the minimum nitrogen purity level required and control at that level. Don’t increase unless you know the cost.
- To be sure, always check with the manufacturer.
For more information on APenergy visit apenergy.com or call 740.862.4112.
To read similar Nitrogen Generation Technology articles, visit https://www.airbestpractices.com/technology/air-treatment.
Visit our Webinar Archives to listen to expert presentations on Nitrogen Generation Technology at https://www.airbestpractices.com/webinars.
Published March 2024 in Compressed Air Best Practices® Magazine.