Collecting and analyzing accurate information is essential for evaluating cost- and energy-efficiency
Compressed air systems are a cornerstone of modern industrial operations, providing essential power for a variety of processes. However, these systems are notoriously energy-intensive, with as much as 90% of the energy input being lost to heat of compression, frictional losses and motor inefficiencies. Due to their dynamic nature, compressed air systems can be challenging to understand well and easy to misinterpret, which is where accurate data measurement and analysis play a key role.
The primary goal of measurement in compressed air systems is ensuring they meet process requirements – specifically pressure and flow – in the most cost-efficient manner possible. Accurate data collection, management and analysis are crucial in ensuring this goal is achieved. This article highlights key data measurement requirements, the significance of accurate measurements and typical sensors required for data collection, then presents case studies that demonstrate the importance of accurate measurement data when evaluating system performance and cost efficiency.
The three key process parameters that require quantifying through measurement and analysis are input power, system flow and pressure. Input power, the rate of electrical energy transfer, not only helps us determine the cost of producing compressed air, but is also important in determining system efficiency. Flow measurements are critical in understanding system efficiency, while pressure measurements allow us to ensure the system consistently meets process requirements.
Typically, we evaluate system efficiency through the lens of specific power of the compressed air system, which is a ratio of the rate of energy use (measured in kilojoules per second, or kilowatts) and measured as input power versus the rate of air production, measured as system flow in cubic feet per minute (cfm) in North America, or m3/hour or m3/min in other areas. In North America, which is where we will focus, specific power is measured in kW per 100 cfm.
Most commercially available air compressors have a published rating for specific power from the manufacturer. It is important to note the manufacturer’s specific power is typically in kW per 100 actual cubic feet per minute (acfm) at inlet conditions, whereas most flow meters will produce measurements in standard cubic feet per minute (scfm), which is measured at standard temperature, humidity and pressure (temperature: 68°F (20°C), pressure: 14.7 psi (1 bar or 101.3 kPa), relative humidity: 0% (dry air)).
Converting scfm to acfm requires measurements of ambient inlet air temperature, humidity and pressure. Ambient air temperature, humidity and pressure all impact the density of the inlet air, which ultimately impacts the actual mass flow rate of air through the system (as positive displacement compressors are volumetric devices), and that will impact the pressure developed within the compressed air system. Converting between acfm and scfm is well understood and documented but is beyond the scope of this article.
Determining Input Power
Input power, the instantaneous electrical energy rate of transfer, is determined by measuring input amps, power factor and voltage. Input energy consumed can then be determined by aggregating the measured input power within each measurement time interval. Amperage measurements determine the amount of current being used. Power factor is the ratio between real and apparent power, usually resulting in a power factor of slightly less than 1 for a fully-loaded induction motor since apparent power is typically higher than the real power required by the compressed air system. Apparent power is higher since some additional level of current is required to magnetize the induction motor. Power factor varies with the load on the motor and across phases, and is much lower than 1 at lower loads relative to fully-loaded induction motors. Assuming a constant power factor would introduce a significant error, so the power factor should be either measured directly or determined depending on the level of amps being measured relative to full-load amps (fla) for the motor.
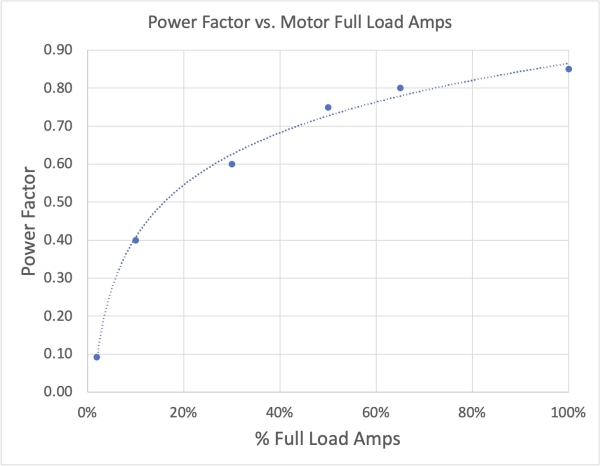
Figure 1: Typical power factor curve.
Since compressors are typically driven by three-phase inductance electrical motors, the measurement of input power is accomplished in one of two ways:
1 - Measuring amps using a clip-on or wrap-around current transformer (CT) on a single phase, estimating power factor using some sort of standardized curve based on the motor loading relative to fla (See Figure 1), and estimating input voltage to calculate input power in kW using the following formula for three-phase power (where supply voltage is measured phase-to-phase):
P[kW]=Amps×Supply Voltage×√3×PF÷1,000
2 - Measuring input power directly using a three-phase power meter where amps, power factor and input voltage are measured individually and concurrently on all three phases to determine the true total input power (See Figure 2). Input power and energy are then automatically determined based on these measurements for each time interval.
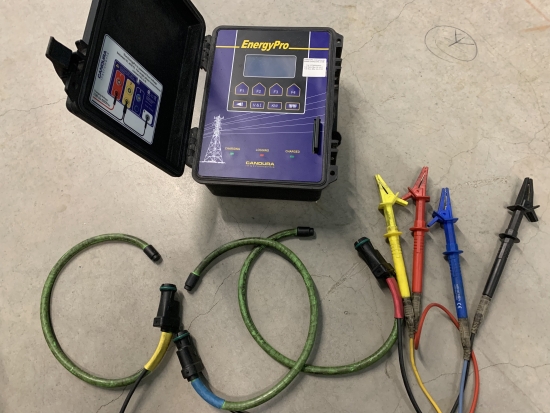
Figure 2: Typical three-phase power meter.
Measuring input power with a three-phase power meter is by far a more accurate approach, as we will discuss in one of the case studies, primarily since it is relatively common to have unbalances in power usage between each phase of the inductance motor. That will also result in differences in power factor for each phase, and there are often variations in supply voltage over time. As a result, taking a single amperage measurement on one phase and assuming power factor and supply voltage can result in significant errors in the resulting input power.
Measuring Flow
Flow measurement is also vital to compressed air system analysis. It’s common in compressed air demand studies for auditors to use input power data to estimate compressor flow data using performance data from the manufacturer for that particular model. Some of the key factors that impact the accuracy of this approach include:
• Performance data is not always readily available for older machines, and often newer machines are able to produce higher flows than older models due to design improvements over time. Older machines may also operate at lower than the manufacturer’s rated flow due to mechanical wear. For example, in a recent assessment a 20-year-old machine nameplate stated 426 cfm while the current machine nameplate stated 471 cfm for the same model – an 11% increase. Using the rated manufacturer data for the new machine to model the older machine would overstate the efficiency of the system.
• Modeling flow using manufacturer performance data will not produce correct peak flow values. Without a measured flow value, the maximum peak flow will never exceed the manufacturer’s stated maximum value, which does not account for true system peak flows that may occur.
Different types of flow meters offer varying levels of accuracy and suitability for different applications. The following table itemizes typical flow meters commercially available and their main differentiating factors. The key to effective flow measurement is ensuring the flow meter is installed in a clear and straight portion of piping free of upstream and downstream fittings. The most common meter used is the insertion style thermal mass meter, which can be installed live into a system.
| Type | Description | Advantages/Disadvantages |
| Vane style anemometer | Radial fan shape, held against inlet air filters or mounted on inlet air |
|
| Thermal Mass | Measures the temperature differential between two heating elements; this differential, in combination with the supplied heating power and fluid properties, allows the meter to determine the mass flow rate accurately |
|
| Vortex | Measures the flow rate by detecting vortices shed by a component placed in the flow stream using a frequency sensor |
|
| Venturi | Uses Bernoulli’s principle and the measurement of the pressure differential of the air flow relative to a reduced throat |
|
| Orifice Plate | Creates a pressure difference and relates to the flow rate |
|
Pressure Sensors
Pressure sensors typically use electronic strain gauges to detect the deformation of a steel diaphragm under pressure. There are several commercially available models that are easy to install and are usually supplied with a standard quarter-inch NPT connection (See Figure 3). They can be installed with the system live and provide accurate readings.

Figure 3: Typical pressure sensor.
Case Studies on Measurement Approaches
The impact of accurate measurement approaches can be demonstrated through the following case studies.
Case Study 1: Input power using single-phase measured amps versus true power. In a 75-horsepower (hp) load/unload air compressor system, the maximum rated motor amps were back-calculated from the manufacturer’s rated input power using 575 VAC supply voltage and a power factor of 0.85, giving a calculation of 77 amps. However, the measured data showed approximately 100 amps when fully loaded. This discrepancy, likely due to an unbalanced amperage draw between phases, results in an overestimation of power consumption by almost 20%, making the machine appear significantly less efficient than it actually is and negatively affecting the accuracy of the results and the conclusions drawn.
Case Study 2: Measured flow vs. calculated flow. A system contained two rotary screw air compressors with inlet modulation control, one 300-hp and one 350-hp. The total system flow was measured using a thermal mass insertion-style meter. The flow was also calculated using performance data supplied by the manufacturer and the measured input power. The actual measured flow was significantly lower than the calculated flow. If the study had relied solely on the calculated flow, this would have significantly impacted the perceived efficiency of the system.
The calculated flow data suggested a specific power of 21.3 kW/100 cfm, whereas the measured flow indicated a specific power of 37.1 kW/100 cfm. The measured specific power highlights the potential for significant cost savings, which would have been missed if relying on calculated flow values.
By using measured flow data, a 45.6% reduction in total cost was realized, amounting to \$175,000 per year, compared to a small 2% cost reduction (\$8,000 per year) using calculated flow data.
Accurate data management and analysis are indispensable for optimizing compressed air systems. By leveraging precise measurements of input power, flow and pressure, industries can achieve significant cost savings, improve system efficiency and ensure their processes run smoothly. The case studies presented highlight the potential errors that can occur between calculated and measured data, underscoring the importance of accurate measurements in achieving optimal system performance. As technology advances, the integration of sophisticated sensors and data analysis tools will continue to play a crucial role in the efficient management of compressed air systems, driving both economic and environmental benefits.
|
About the Author Andrew Smith is a registered professional engineer in Ontario and British Columbia with over 20 years’ experience in compressed air auditing and analysis, including successfully developing and implementing IOT-enabled custom compressed air controllers. Andrew has a Master’s in Applied Science from the University of Waterloo and a Bachelor of Applied Science in mechanical engineering from the University of Toronto. |
 |
To read articles on Air Compressor Technology, please visit https://www.airbestpractices.com/technology.
Visit our Webinar Archives to listen to expert presentations on Air Compressor Technology at https://www.airbestpractices.com/webinars.