It is common to see energy assessment specialists treat centrifugal compressors like positive displacement compressors when attempting to reduce compressed air system energy consumption. Unfortunately, centrifugal compressors are normally much larger, and miscalculations can easily represent hundreds of thousands of dollars in overestimated energy savings. These errors are not malicious; they result from oversimplified best practices perpetuated by individuals with limited centrifugal compressor knowledge. This type of knowledge is not readily available and most energy assessment specialists do not have access to engineering teams responsible for the technical development and design of centrifugal compressors. From a unit perspective, centrifugal compressors are a small part of the compressor market so technically knowledgeable resources are limited.
Identifying Technical Compressor Resources
It is important to recognize that compressed air sales people represent one of the largest sources of technical information associated with compressed air systems and components. Although some sales people are technically competent engineers, it is not uncommon to find the word “engineer” used as an adjective in a job title. Whether engineer is a title by education or job function, it does not guarantee technically accurate information. Similarly, experience is a term frequently used to imply great knowledge associated with years of practice. Experience may have value for functions with simple cause and effect outcomes or repetitive tasks where muscle memory can enhance performance. However, in an industry where results are rarely measured using accurate instrumentation in controlled environments, many technical myths fester and, through years of repetition, are assumed to be scientifically proven facts. For example, part one of this article that was printed last month, explained how the 1 percent power to 2-psi assumption is abused and why it is not correct.
Working at Ingersoll Rand, one of the world’s largest manufacturers and innovators of compressed air products, facilitates opportunities for many technical discussions with talented engineers that design compressors for a living. Participation in many compressed air related technical teams with ISO, CAGI and CSA also provides opportunity for high level discussion with engineers from other compressor manufacturers. Interestingly, whenever discussing the topic of pressure and power for compressors, almost every engineer regurgitates the same 1 percent power to 2-psi assumption. After discussing systemic attributes and thermodynamics, all agree that the 2:1 statement is inaccurate but many assume it to be a fact, and relate it to how the compressor operates relative to pressure in the network piping. As young engineers new to the industry, the 2:1 statement was technical knowledge shared by senior engineers. Mistaking experience and age for scientific fact, many innocent assumptions went unquestioned.
For sake of closure, the theory appears to have originated in early 1900s as a reasonable estimate based on a complex equation used to calculate brake horsepower for large reciprocating compressors relative to pressure inside the cylinder. This is not applicable considering all the components and technological changes that make up modern compressors. The 2:1 theory is just like a rumor that iteratively morphs into a different story with every person’s interpretation and subsequent sharing. This occurs when complex technical content is simplified and generalized before reaching the field sales people and other individuals disseminating compressor knowledge to the market.

Operating Characteristics of Centrifugal Compressors
Unlike positive displacement compressors in which pressure is a function of mechanical forces (power) acting on a surface that is physically reducing a closed volume, centrifugal compressors cannot increase their pressure capabilities by increasing power. A centrifugal compressor, also known as a dynamic compressor, generates pressure in a different way. A given mass of air is accelerated through an impeller, and imparts kinetic energy. The air goes through a diffuser, reduces the velocity and converts a portion of the kinetic energy into heat and potential energy. This manifests itself in the form of increased air pressure and temperature. Depending on the pressure requirements of the compressor, air goes through the same process through subsequent stages and builds toward the design pressure requirements. To improve efficiency, some or all stages cool the air before it enters the next stage. For discussion purposes, the operating explanation has been simplified in an effort to remain within scope. The pressure capabilities of a centrifugal compressor are dictated by aerodynamic design of the internal components, ambient conditions, rotating speed and cooling of the air between stages.
The relationships between flow, pressure and power for a centrifugal compressor are normally expressed using a performance curve based on specified ambient conditions, cooling water and applied internal components. As a result, the performance — and most notably — pressure capabilities change as ambient conditions change throughout the year. A working curve that consists of overlapping data from three sets of ambient conditions is utilized to illustrate this effect in Fig. 1.
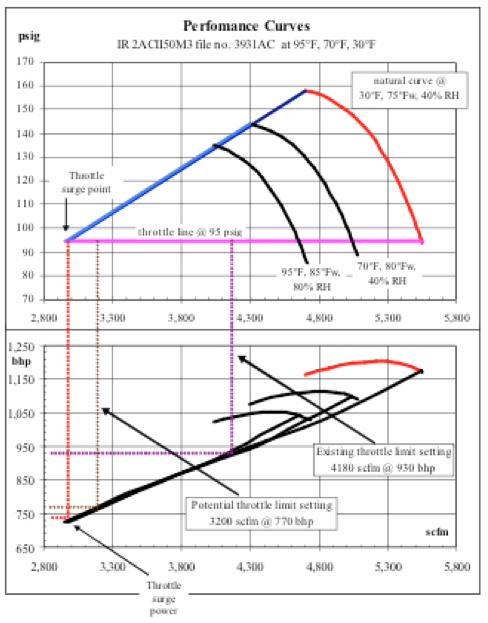
Figure 1 – Centrifugal Compressor Performance Curves
The performance curve is made up of two parts: the pressure-flow curve and the power-flow curve. The pressure-flow curve has pressure on the vertical axis and flow on the horizontal axis. The power-flow curve has power on the vertical axis and flow on the horizontal axis. The flow values for each horizontal axis align so each pressure-flow curve has a matching power-flow curve. Notice how the natural curve moves up and to the right as ambient temperature decreases. Looking at the red curves for power and pressure with respect to flow, moving from left to right, a vertical line intersecting both curves illustrates the design pressure and power for that specific flow and ambient conditions. Moving from left to right, notice how the power initially increases as pressure goes down and then decreases as one moves further to the right. This illustrates how power is not directly proportionate to a change in pressure. This relationship is based on the aerodynamic design of the internal components. Some compressors that use a radial design impeller have maximum efficiency at the top of the curve just before natural surge. A backward leaning design may increase efficiency as pressure decreases or may achieve peak efficiency at some point on the curve and then decrease at lower pressures.
Referencing the red pressure-flow curve, note that as the pressure decreases, the flow for the compressor increases. A centrifugal compressor performs relative to the natural curve when the inlet assembly is open 100 percent, or enough that opening the assembly more has no impact on inlet throat pressure. A compressor operating at the maximum state is sometimes referred to as operating at full load — or on the active part of the curve where flow changes with respect to pressure. Flow increases as pressure is reduced but notice how the slope of the curve changes as pressure decays. Eventually the curve becomes asymptotic — straight up and down — when the compressor moves into a region known as choke or stonewall.
At this point, dropping pressure has very little to no change on flow or power. The power does not decrease when the compressor operates at or below choke. When the compressor is in choke, velocity has reached a sonic threshold at some points within the compressor. Subsequently, the compressor retains internal pressure at a minimum value independent of discharge pressure external to the compressor. In essence, internal pressure decreases with respect to external pressure until it reaches a minimum internal pressure. Below this minimum value, pressure only decreases in the system while internal pressure stays at the minimum value constrained by the sonic velocity limit.
The upper pressure is limited by the compressor’s ability to convert kinetic energy into pressure. At some energy balance, generated pressure is less than internal pressure, causing instability sometimes referred to as flow reversal or surge. Compressor operation is unstable at, or close to, the surge pressure. The pressure capability, or natural surge pressure, can only increase if inlet air density increases. This same phenomenon occurs at a minimum stable flow condition called the throttle surge. If demand for air is less than supply for a required pressure, the inlet assembly modulates, reducing inlet throat pressure and flow. This is commonly referred to as a compressor operating in modulation, on the throttle or at constant pressure.
The Influence of Pressure on Centrifugal Compressor Power
Looking at performance within the active part of the curve, Fig. 2 illustrates the detailed changes in flow and power relative to discharge pressure.
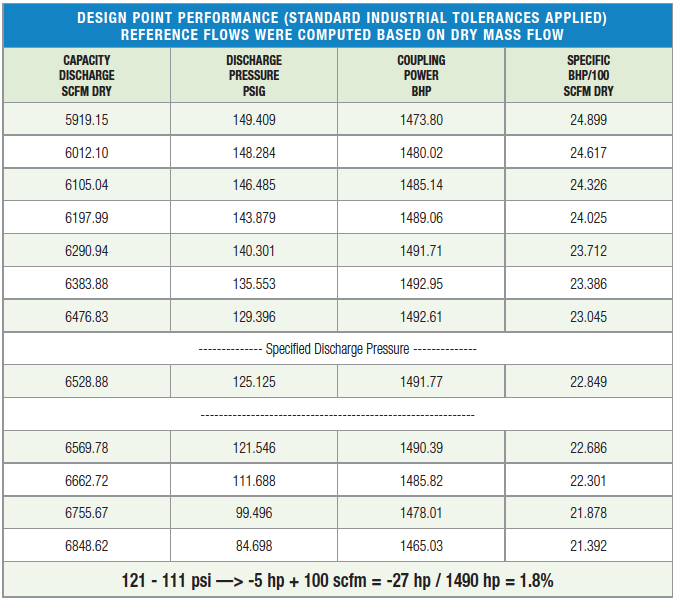
Figure 2 – Sample Centrifugal Compressor Performance Data
The data in Fig. 2 is based on tested performance for a specific centrifugal compressor. Looking at compressor performance at 121 psig and 111 psig, reducing pressure from 121 to 111 psig only lowers power by 5 horsepower. This represents less than 0.35 percent reduction in shaft power. The .5 percent per psig rule (described in Part 1: Air System Pressure Influences Compressor Power that ran in the July issue of Compressed Air Best Practices) does not apply. It would have predicted a 5 percent reduction in power with an estimated savings of \$50,000 per year, as opposed to the \$3,000 realized. In this example, savings estimates could be grossly exaggerated to more than 16 times the actual value.
Since the compressor in this example is operating within the active range of the curve, flow increases ~100 scfm. Assuming demand stays the same and the compressor power changes directly proportionate to the change in flow, the compressor shaft power is reduced by a total of 27 horsepower or 1.8 percent. This is less than 36 percent of the savings estimated using the .5 percent per psig rule of thumb, delivering \$18,000 of savings as opposed to \$50,000 using the incorrectly applied calculation. If the compressor normally operates in a modulated state using a correctly applied inlet guide vanes, shaft power is reduced 1.7 percent.
It is important to note that unlike rotary screw compressors, centrifugal compressor model numbers do not necessarily represent performance of the compressor. Several different impeller/diffuser combinations may be used for a given external casting, design and motor. The combination of impellers and diffusers is commonly referred to as the “aero” of the compressor. Several different aero packages can be used for a given compressor model number and each has its own unique performance ability. One cannot use a generic curve — or even a curve from the same model of compressor — unless the manufacturer confirms that the compressors were manufactured using the same aero.
It is equally important to ensure data is corrected for site conditions or a range of conditions if ambient changes with respect to time. Referencing Fig. 1, the three curves (from left to right) represent data from ambient conditions at 95 °F, 70 °F, and 30 °F. Based on how the performance curve shifts relative to temperature, it is not uncommon to find compressors that operate in choke for several months a year. This is significant since any estimates for energy savings associated with pressure must take into consideration time, temperature and location on the curve. Without this data, any attempt to estimate savings associated with pressure may be misleading. In some cases, power can increase as pressure is reduced.

Energy Savings for Centrifugal Compressors
Maximum pressure capabilities of a specific compressor are based on the aero package, ambient conditions and mechanical condition. The maximum operating pressure is limited by the compressor surging at the top of the curve. This point is called the natural surge pressure. Referencing Fig. 1, the pink horizontal line represents the constant pressure line. When demand is less than the maximum flow from the compressor, the inlet throttles to reduce flow. With inlet guide vanes, the efficiency remains reasonably constant while the compressor is throttling. The throttled power is shown on the lower power–flow curve as the diagonal line. The minimum throttled flow for a centrifugal compressor is limited based on design. Following the pink horizontal line in Fig. 1 to the left, the minimum stable flow is dictated by the point where the constant pressure line intersects the throttle surge line. If the compressor attempts to limit flow to less than this intersection point, the compressor surges. For obvious reasons, this is called a throttle surge. The throttle surge line can be seen on Fig. 1 as the blue diagonal line on the pressure-flow plot.
If the demand for air is less than this minimum constraint, excess air is discharged to the atmosphere to compensate for the difference between minimum stable flow and demand requirements. Unfortunately, after the compressor stops throttling, the power does not change. Consequently all the air that is discharged into the atmosphere is wasted. For a compressor that operates frequently with air bypassed to the atmosphere, lowering pressure reduces the flow where throttle surge occurs. After adjusting control settings, a compressor that operates at minimum flow still reduces power by increasing throttle capabilities relative to the reduced throttle surge flow. This is only the case if the compressor bypasses air in to the atmosphere and the controls allow the compressor to modulate the inlet, which increases throttle capabilities and decreases power. Once again, the site corrected performance curves are required to quantify the potential savings.
The ability to operate a compressor close to throttle surge is limited by the complexity of the control algorithms, throttle variable used, and how the compressor PID loops are tuned relative to system dynamics. Fig. 1 illustrates the power reduction associated with adjusting the compressor throttle limit from a conservative setting to a more efficient setting by tuning the compressor PID loop so compressor reaction rates match the rate of demand changes. The change in power associated with adjustments in the system controls can be seen by looking at the two vertical dashed, purple and brown lines from the constant pressure line to the throttled power line in Fig. 1. For this compressor, power was reduced 160 hp with no capital investment. The compressor still bypassed air into the atmosphere, but the amount was reduced 980 scfm, associated with modulating the compressor closer to the throttle surge value. It is important to note that the throttle surge control limit is normally set high for a reason. Appropriate root cause analysis is required to define the problems that influence the elevated settings. As an organization that has audited hundreds of centrifugal compressor systems using advanced technical detail and analytics, Ingersoll Rand realizes corrective actions can vary significantly between systems. In some situations, six figure savings can be realized by correcting a complex problem with a \$100 investment. Inversely, savings can require complex and expensive corrections that are not justifiable.
Centrifugal Compressor Performance Assessment
It is important to point out that the performance of a centrifugal compressor can change dramatically over time due to mechanical degradation of internal components. Although major issues with rotating assemblies can be identified through elevated vibration readings, erosion of impellers and diffusers can significantly reduce pressure capabilities, reliability and efficiency of a centrifugal compressor with negligible impact on vibration. For this reason, a performance assessment should be done for each centrifugal compressor on a regular basis and as part of any energy conservation project. Any compressed air system assessment that does not include detailed testing and analysis of compressor performance will have insufficient or questionable data and may be an indication of the auditor’s centrifugal compressor competency.
It is also important to note that previous repairs to a centrifugal compressor may have significantly changed performance. Some aftermarket service providers replace internal aero components that do not match the original design. On some occasions, instead of replacing components, cost can be saved by grinding down impeller blades and rebalancing the assemblies. This addresses vibration issues but can dramatically alter performance.
Referencing the curve in Fig. 1, this compressor is capable of delivering 135 psig at the 95 °F condition. If this compressor is sold as a 90 psig unit, many centrifugal service providers test natural surge pressure and consider it a performance test. Having worked with many compressor aero-engineers on the development and verification of centrifugal compressor performance analytics and on-site nonintrusive test procedures, it is safe to say there is significantly more to assessing compressor performance than testing surge pressure and vibration. Common centrifugal compressor service assumptions consider a natural surge pressure greater than 10-15 percent above design pressure to be normal, regardless of temperature. Consequently, surge testing the compressor in Fig. 1 and achieving a natural surge pressure greater than 103 psig is considered positive verification of performance by many organizations. This is not done with malicious intent, it ties back to the beginning of this article and the issues associated with experience and perceived knowledge. Just as the misinformed engineer could innocently estimate \$100,000 of savings when there are none, many field technicians would execute what they are told is a performance test, unintentionally neglecting to identify degraded compressor performance and reliability.
About the Author
Mark Krisa is director of global services solutions at Ingersoll Rand, and leads the company’s compressed air audit program. This program is designed to deliver customer value by leveraging engineering and compressed air science to improve system reliability, quality and efficiency.
Krisa graduated from the University of Western Ontario in Canada with a degree in engineering science, and has worked in the compressed air industry for more than 20 years. His experience in the industry is diverse, ranging from compressor service technician to engineering and compressed air system auditor. Krisa is author of several papers and speaks regularly at conferences and training events across the Americas. Please contact Mark Krisa with questions or comments.
To read Part 1 of the article please click here. To read Part 3 of this article, please click here.
To read more System Assessment articles, visit www.airbestpractices.com/system-assessments.