It is very frustrating when you do everything right in purchasing and installing your compressed air system, but after some time things start to go terribly wrong. A metal products company producing parts for the transportation industry (name and location withheld to protect the innocent) has recently experienced this emotion. Their system was designed and built to achieve premium performance, yet in a recent compressed air assessment the numbers showed their system had surprisingly poor performance, and worse, their staff was unaware of the problems. This article discusses some of the challenges faced and some future solutions that could get their system back to higher performance levels.
Compressed Air System Set-Up
The company’s compressed air system (Figure 1) consists of four (4) premium efficiency two-stage water-cooled lubricated screw air compressors (all 200 hp rated at 100 psi, one is VSD controlled) with total rated output rated at about 4,000 cfm capacity (1,050 cfm each). The air compressors are controlled using an automatic sequencer. All four compressors have variable displacement control through manually controlled spiral valves. The system is arranged with two compressors located on the East side of the plant and two on the West side.
The air is filtered and dried using two (2) air-cooled cycling thermal mass refrigerated dryers rated for 2,000 cfm. East-side air compressors have efficient mist-eliminator filtering applied to each compressor. West side has two oversized standard coalescing filters installed in parallel.
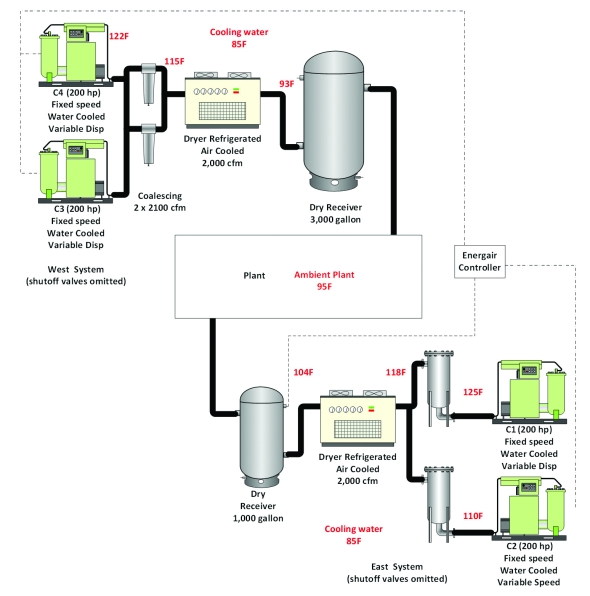
Figure 1. The compressors of this system are premium efficiency units that are controlled by a central sequencing controller. The customer chose to install equal sized base and VSD compressors which, due to extenuating circumstances, has created to a control gap issue. Click to enlarge.
Baseline Study
Last year a utility funded baseline study was done using data loggers to measure and track compressor power, plant pressure, air dew point, and compressed air flow for a one-week period (Figure 2). The instruments showed surprising results; the system was running at much lower than desired efficiency, with specific power of 26.8 kW per 100 cfm, with the system consuming 2,900,000 kWh costing \$197,000 per year. Optimal specific power for a system of this size and type, while running at about 95 psi, is around 17.5 kW/100 cfm. Leakage flow was estimated at 700 cfm during non-production hours representing 46 percent of the average air flow.
These results were surprising because the plant maintenance staff was regularly monitoring system specific power and leakage levels using a remote monitoring function of their compressor controller. The controller told them that their system was running quite efficiently at 17 kW per 100 cfm with a low level of leakage. Further investigation by a compressed air auditor revealed the reason for the differences in reported parameters.
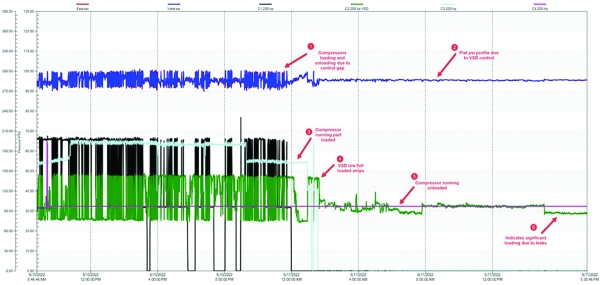
Figure 2. The initial baseline data logging showed some obvious problems with compressor control, this was not a problem caused by the compressor sequencer, but the result of some local compressor control issues, including unwanted human intervention. These issues caused the controller HMI to report incorrect results. Click to enlarge.
Baseline Showed Problems
The initial look at the baseline readings showed some obvious problems (Figure 2). A well-controlled system using a sequencing controller with both fixed speed and variable speed compressors should be showing a pressure profile like that indicated at point 1, a flat profile with very little change in pressure, except when base compressors switch on or off. Problems observed:
- Normal VSD controlled pressure profile is quite flat due to precise electronic control,
- The sawtooth waveform shows compressors constantly loading and unloading which is the result of control gap due to a mismatch between the size of the VSD and the base air compressors,
- C3 was running partly loaded either with inlet modulation or variable capacity, the compressor controller was expecting that all the running compressors would be fully loaded,
- The VSD compressor was showing low amps, meaning it likely had an output much less that its rated capacity, this caused “control gap”.
- C4 was running unloaded as a result of production staff putting the unit in manual control while trying to keep the pressure constant,
- Weekend loading showed significant non-productive flow, usually indicating high leakage levels, however, the installed flow meters had become contaminated (Figure 3) and were showing incorrect lower flow values, leading the maintenance staff to believe their leakage levels were acceptable.
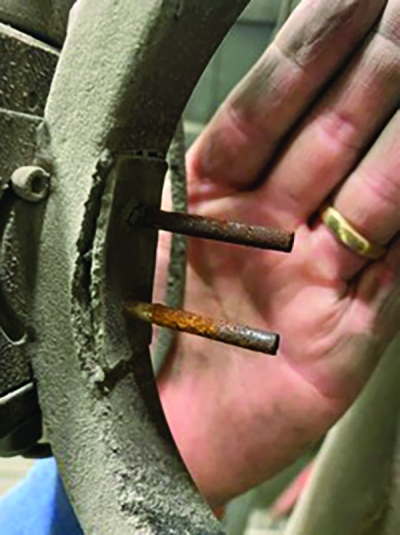
Figure 3. Due to dirty and hot environmental conditions the thermal mass flow meters installed at this site were contaminated and reading low, leading maintenance staff to believe their leakage levels were acceptable.
Controller Reporting Errors
Due to local compressor control issues, contamination of the flow meters, and the characteristics of the compressor controller reporting algorithm, the maintenance staff were not receiving accurate information about how well their system was running. This is a common characteristic of compressor controllers, the reported power and flow values used in calculating system specific power and flow are often not real numbers, but are simulated based on pre-programmed compressor characteristics entered into the memory during the controller commissioning. The reason this is done is because most compressed air systems do not have power meters and flow meters installed, so to give compressor operators some indication of system operating parameters various assumptions are made:
- The controller assumes if it sends a load signal to the compressor it will be fully loaded producing full rated flow and consuming full rated power,
- In unloaded condition the controller assumes the programmed unloaded power and zero flow,
- In stopped condition zero power and flow are assumed.
With this system, due to problems with local compressor control, there was a mismatch between the reported flow and calculated actual flow. For example, compressor #3 control had a sticking inlet valve causing the compressor to output only 40% of its flow, yet the controller assumed 1,000 cfm output, and this is what it reported to the controller interface.
An additional problem was caused by personnel in the plant playing with the compressor controls. Occasionally plant personnel perceived that the compressed air pressure was too low for their liking, so before critical production activities took place, they would place the compressor controls in local mode with the auto shutdown feature turned off. This can be easily done because it was a simple push button function on the local compressor control. The personnel were unaware that doing this would make the main sequencer blind to the operation of the manual controlled compressor and would allow the compressor to run unloaded, wasting power for extended periods of time.
Environmental and Temperature Issues
Due to the characteristics of the operations within the plant there was a significant amount of dust contained in the ambient air. This made it necessary to purchase water-cooled compressors to avoid cooling issues, however, over the years the coolers on the compressors started to become contaminated. Figure 1 showed some challenges with the discharge temperatures of various air compressors which was overloading the air dryers.
The amount of water vapor doubles with every 20 degrees F increase in compressor discharge temperature. The air dryers are only rated for 100 degrees F inlet temperatures, causing the dryers to be overloaded during hot summer days. Further to this, some dust from the ambient air that gets by the compressor inlet filters and is ingested by the air compressors, then mixed with the water within the compressed air system, and then contaminates the dryer condensate drains, causing them to fail. This caused higher than desired dew points of around 80 degrees F, risking the presence of free water in the compressed air pipes.
The high ambient temperatures within the plant caused further problems with the VSD compressor. Staff found they would lose the main drive motor due to bearing failure if they allowed the compressor to go to full rpm, so in self-defense the maximum speed of the VSD drive was manually turned down. This saved the motor but caused a mismatch in capacity between the VSD and the fixed speed compressors.
Control Gap Sizing and Control Rules Broken
One basic rule in compressor control is that all the running fixed speed compressors should be fully loaded, and if they are not needed they should automatically turn off. And only one compressor, the VSD in this case, should be taking part load. The maintenance of this rule is the job of the compressor sequencer.
There is also a general rule in sizing VSD compressors that operate in a system with fixed speed compressors. If this rule is broken there will be control gaps occurring at various places along the system capacity profile. The rule states that the variable part of the VSD capacity must be equal to or larger than the largest fixed speed compressor with which the VSD must work.
Both of these rules were being broken in this plant and as a result the efficiency was poor. For this system the fixed speed compressors have a capacity of about 1,000 cfm fully loaded, however, the capacity of the VSD compressor, with its maximum rpm adjusted downward due to motor problems, was only 800 cfm. This created a control gap at flows between 800 and 1,000 cfm and another gap at a system flow of 1,800 to 2,000 cfm, and of course for this system Murphy’s law intervenes, making sure significant hours are spent within the control gap. In looking at Figure 2 we can see the typical sawtooth waveform on the pressure profile, a sign of control gap when using a VSD compressor. In this control gap one or more fixed speed compressors will fight for control with the VSD, causing the system to run poorly, even though it has an efficient central controller installed.
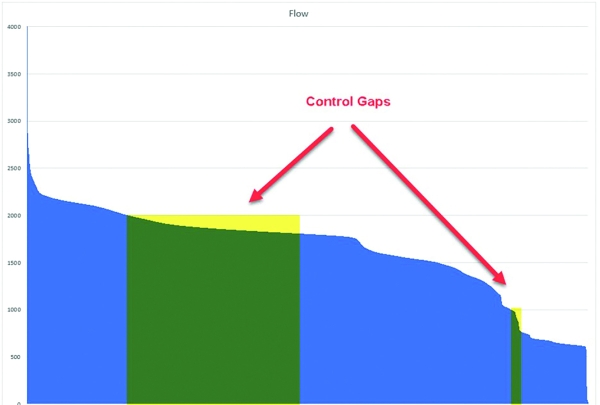
Figure 4. The flow profile histogram of this system shows that the system is within the two control gaps a significant percentage of the time. Click to enlarge.
Leakage Detection & Repair Efforts
Further study was done to try to detect and repair compressed air leakage with the goal of saving significant energy. An initial detection effort was carried out using a standard ultrasonic leak detector gun, however some challenges were encountered. Many leaks were in locations that were difficult and dangerous to access behind locked barriers, the site had many areas where molten metal or very hot items made feeling around to locate a leak a safety risk to personnel. This made the exact location of the leakage almost impossible to identify. In addition, there were many large leaks that were masking out the sound of smaller leaks. The initial leak audit found about 28 large leaks that needed attention.
During the audit a demonstration unit of a Fluke ii900 Industrial Acoustical Imager came available for use. An additional full plant scan using this device increased the number of total leaks found to 40, an increase of 40%. We also found that the time taken in identifying the exact location of the leaks in this complex plant was reduced by about 75% when the new detector was used.
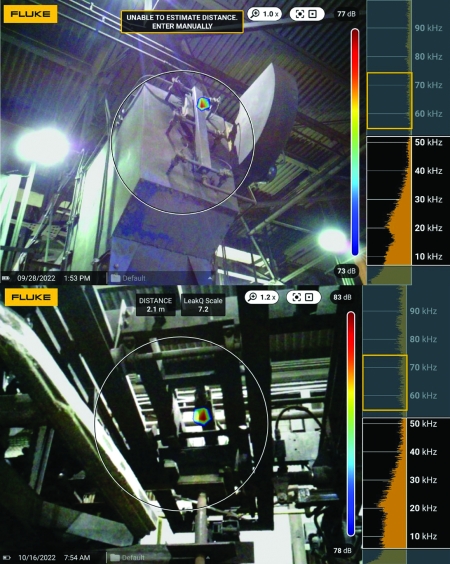
Figure 5 Top: The elevated leak on the dust collector manifold was missed by the ultrasonic gun but was found with the Fluke ii900 Industrial Acoustic Imager and easily identified from the ground.
Figure 5 Bottom: a large leak in a heat treatment furnace door mechanism was difficult and dangerous to reach when detected using an ultrasonic gun, but it is quite easy to identify, classify and estimate when shown on a Fluke ii900 Industrial Acoustic Imager (Source: Fluke ii900).
Conclusion
Improvements at this plant are ongoing with the plan to:
- Reconfigure the compressor capacity to avoid control gap,
- Train plant staff to keep away from changing compressor control modes,
- Adjust and repair local control to maintain fully loaded fixed speed compressors,
- Improve compressor cooling, repair condensate drains,
- Repair and install flow and power meters connected to a separate monitoring system so real readings can be obtained to ensure the system is running correctly,
- Repair leakage and maintain an ongoing leakage repair program.
At the time of this writing some good improvement has already been achieved through some simple local air compressor control adjustments, reducing the average system specific power to about 20 kW per 100 cfm, saving about $50,000 per year, but in order to gain long term permanent savings some additional work will be required. Leakage has already been reduced to under 500 cfm.
For more information about this article contact Ron Marshall, Marshall Compressed Air Consulting, tel: 204-806-2085, or visit www.marshallcac.com.
To read similar Air Compressor Control or Leak Detection articles, visit https://www.airbestpractices.com/system-assessments/compressor-controls.
For expert presentations, visit our Webinar Archive Section dedicated to Air Compressor Control Technology or Leak Detection at https://www.airbestpractices.com/magazine/webinars.


