A food processor was having compressed air problems, so they invited a compressed air auditor into their plant for an assessment and to help them size future permanent air compressors. The plant was experiencing low air pressure and detecting water in the compressed air lines despite having a desiccant air dryer. The auditor thoroughly analyzed the compressed air system production equipment and did end-use assessment and leakage detection. This article discusses the findings leading to a potential cost savings of 52% of the current level.

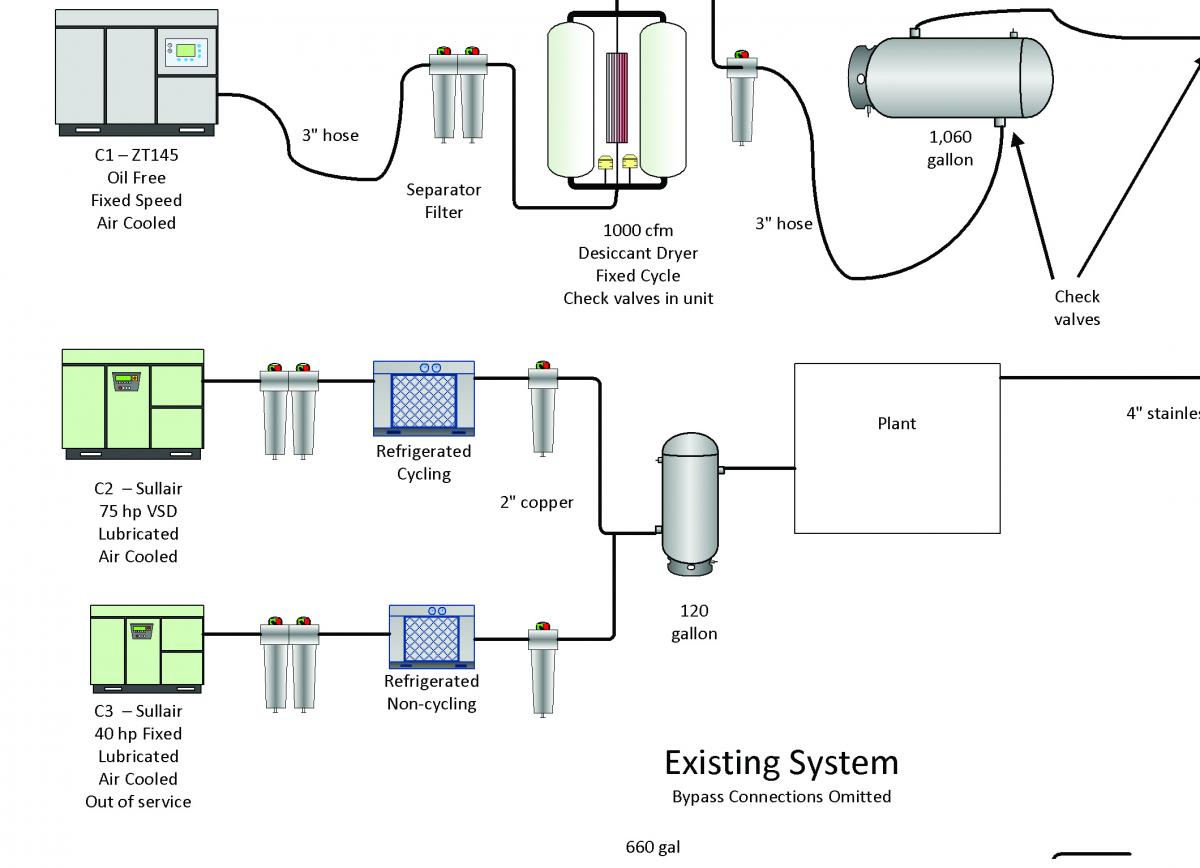
Figure 1: The site had a mixture of oil-free and lubricated air compressors with different dryer types. As a result, the air quality was not meeting with corporate standards for food-quality compressed air.
Multiple Areas of Opportunity Examined
The plant involved produces and packages milk products. The study was designed to quantify the current and potential operating costs, estimate operating profiles, and calculate potential operating savings based on recommended energy conservation measures. The audit consisted of site measurements with electronic data loggers monitoring pressure, power and flow, and also included ultrasonic leak detection, visual inspections, research of potential energy efficiency measures and interviews with facility personnel.
The compressed air production and conditioning equipment consisted of one large rented 145 kW lubricant-free air compressor and two smaller permanent lubricant-injected air compressors (75 and 40 horsepower, respectively) that were originally part of the plant before an expansion took place (Figure 1).
When new production was added the plant decided to upgrade their air quality to the corporate standard of lubricant-free Class 0 air quality per ISO 8573-1, at which time a large lubricant-free air compressor, a heatless desiccant dryer, and 1,060-gallon-storage receiver was installed on a temporary rental basis. It was hoped that the oil-injected air compressors and associated refrigerated dryers would only be run in emergencies if there was a shutdown of the lubricant-free air compressor. Unfortunately, the plant flow was regularly exceeding the capacity of the lubricant-free unit, and the 75 horsepower (hp) Variable Speed Drive (VSD) air compressor was required to supplement the capacity. A smaller 40 hp air compressor had reached the end of its useful life and was taken out of service leaving the plant with a deficit of capacity during production peaks. Even with the two air compressors running, and with the use of a desiccant dryer, the plant experienced pressure and air quality problems. Something had to be done, so a compressed air auditor was called in to investigate.
Pressure and Power Profile
Plant personnel were concerned the compressed air piping was being overloaded by excessive flow and were thinking this was the cause of the pressure issues. To check the pressure gradients the auditor placed pressure data loggers at the air compressor discharge, after the air dryer, and in a central location in the plant where low pressure was being experienced. Power loggers were also placed on the two running air compressors to track the performance of the equipment and to determine system loading at the times of pressure excursions.
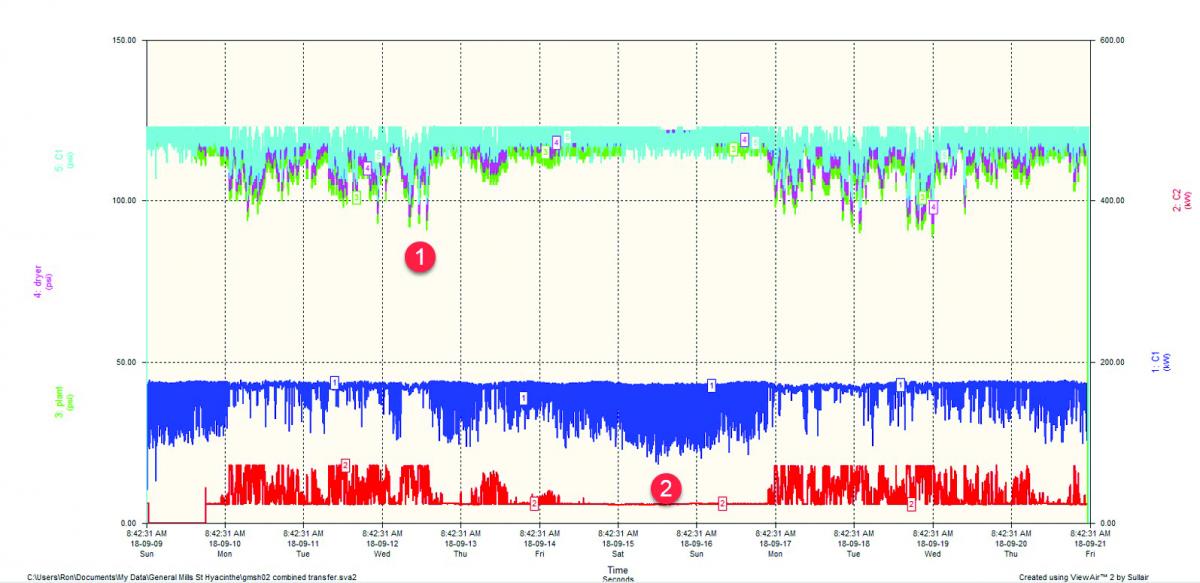
Figure 2 shows there was indeed low pressure, but the air compressor discharge pressure, air dryer outlet pressure, and pressure at the critical location track each other. This shows there is no appreciable pressure loss across the piping or the air dryer. As such, there was a lack of air compressor capacity. The air compressors were experiencing drawdown. This occurs when the load exceeds the capacity of all the running air compressors because the plant pressure will “draw down” to a low level due to a deficit in the compressed air supply since less compressed air is being produced than is being used. In this condition, the pressure must fall.
The power profile also showed a few interesting things; during light loads two air compressors were running, with the VSD unit running at minimum speed, its least efficient point, and the large 145 kW air compressor loading and unloading, also causing inefficiency due to unloaded power consumption. Running two air compressors at a time when only one can feed the load is inefficient because one more fully loaded air compressor would use less power and reduce the maintenance hours. In addition, the oil-free air compressor was found to be rapidly cycling one cycle every 15 seconds during light loads. A check of the air compressor hour meters showed the air compressor had experienced over 700,000 load cycles in one and a half years of operation. This is excessive duty and will prematurely wear out an air compressor.

Figure 2: This pressure and power profile plot shows pressure falling below the critical pressure of 90 psi (top lines designated by No. 1), but during light loads two air compressors continued to run when only one was required (bottom lines designated by No. 2). Click here to enlarge.
Low Pressure Impacts Productivity
The air compressor power was measured over a period of about a month, annual system operation is estimated at 8,760 hours, during which the existing system consumes a projected 1,707,300 kWh of annual electricity. The total electrical costs for the system are estimated at about \$119,700 per year, including taxes. Rental costs are estimated at \$208,000 per year with \$10,000 per year in estimated maintenance costs.
Compressed air production is an average of 800 cfm minus 190 cfm in air dryer purge (610 cfm), with peaks to 1,190 cfm (1,000 without dryer purge). The specific power of the system calculates to 32 kW per 100 cfm of air used when dryer purge is considered. Typical optimized systems of this type would have a specific power in the 21 to 23 kW/100 cfm range. This shows there is good potential for savings if the air compressor control strategy is improved.
Peak plant demands were consuming 1,190 cfm, more than the capacity of the two active air compressors, but this was occurring only 2% of the time. The occasional deficit allowed pressures to fall lower than 100 psi, which reportedly caused production machine shutdowns affecting productivity. The plant also has inadequate air compressor back-up capacity, the failure of any one air compressor will cause difficulties meeting even production demands. The 75 and 40 hp units are of oil flooded screw type, with refrigerated drying, but this is not in keeping with the corporate air quality standards for food product plants.
On the demand side, the system was found to be quite inefficient, with significant leakage and non-productive load, estimated at 300 cfm continuous flow, accounting for 43% of the average consumption. The system was also operating at a higher than required average pressure due to the need to compensate for the pressure dips when the air compressors lacked adequate capacity, this caused higher than normal average air compressor power, and higher than desired artificial demands, further loading the air compressors.

Figure 3: Energy costs were calculated based on the power utility rates. The plant consumed about \$120,000 per year to produce an average of 800 cfm of compressed air, not including dryer purge. The system specific power of 32 kW/100 cfm is in the higher range for similar systems and shows there are efficiency problems with the production of compressed air.
Three Sets of Check Valves Create Issues
As mentioned, the air compressor cycle count was found to be excessive, with the air compressor cycling loaded and unloaded every 15 to 20 seconds during light loads. The auditor found the system installers had placed check valves in the air compressor piping to prevent the back flow of compressed air from the plant to the air compressors.
Check valves like this were needed in the days of reciprocating air compressors to prevent the units’ motors from tripping when they tried to start with pressure in their compression cylinders, but modern-day air compressors have check valves built into the internal circuitry. The desiccant air dryer also has check valves installed within the circuitry to prevent the backflow of compressed air through the desiccant. The presence of not one but three sets of check valves, however, causes problems with load/unload-controlled air compressors with desiccant air dryers.;
Global Food Safety Initiative (GFSI) Compliance: Two Compressed Air System Specifications – Webinar RecordingDownload the slides and watch the recording of the FREE webcast to learn:
|
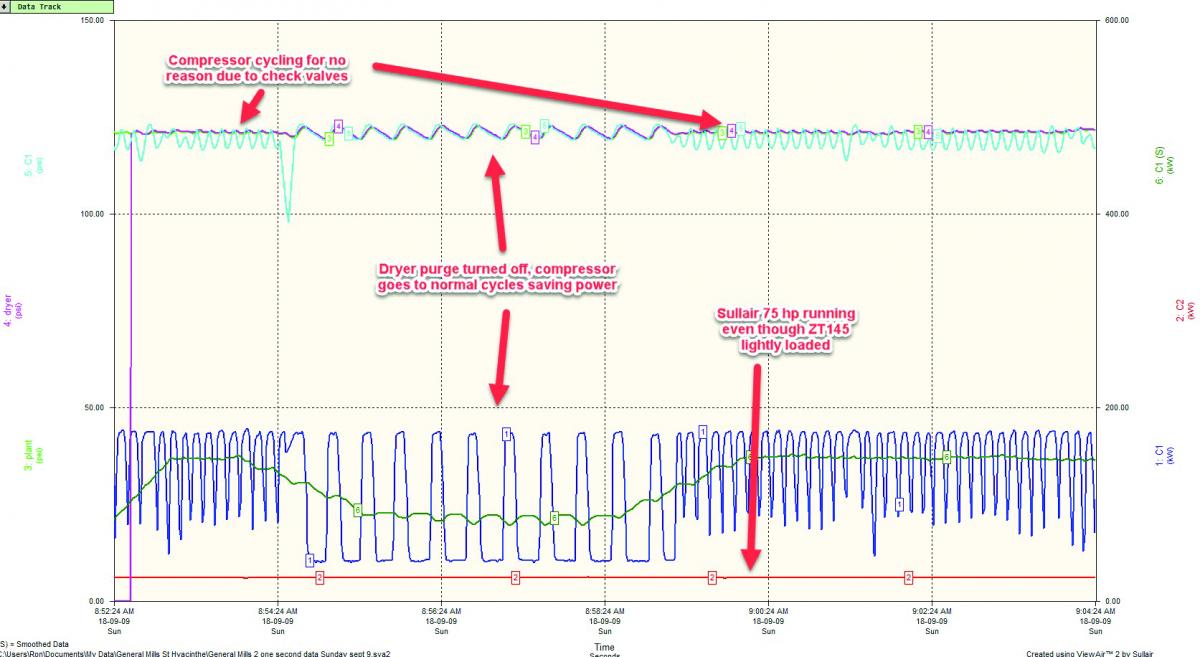
When the air compressor is loaded the output flow from the discharge feeds the air dryer purge, but when it unloads there is no flow to feed the dryer purge flow, which in this case was 190 cfm. This purge demand caused the pressure at the discharge of the air compressor to immediately collapse after each air compressor unload operation, causing the air compressor to quickly load again, even when the plant pressure is not low enough to need the air compressor to load. This rapid cycle operation continued as long as the air dryer is purging. Since the air dryer is a fixed cycle unit, it continually to purged at full flow, even when lightly loaded at a fraction of its capacity.
A test was done where the dryer purge was turned off temporarily as shown in Figure 4. The chart shows when the purge was removed the air compressor started cycling normally, and the power consumption dropped considerably, this shows that if something can be done about the air dryer purge and rapid cycling there could be significant energy savings.
The test also showed that the air dryer purge was 190 cfm, this is based on the change in compressor cycle time in the two conditions, the purge was found to be 40 cfm higher than the rated purge. The dryer was also set on a six-minute cycle (three minutes per side) rather than the normal 10-minute cycle. These extra unnecessary cycles wasted considerable compressed air due to the extra air required to pressurize the dryer vessels each time, only to depressurize them when the cycle ended three minutes later.
A condensate separator had been installed on the air dryer before the inlet filter. This separator had airless condensate drains installed, however, someone had slightly cracked open the manual drain. Interviews suggested this was done because moisture was regularly forming inside the plant pipework, and it was thought that the extra drainage would prevent this problem. After further investigation, however, it was found that a condensate drain on the 75 hp lubricated-air compressor wet receiver had failed closed, allowing the tank to almost completely fill with water. Free water was inadvertently being injected into the plant from this receiver whenever the 75 hp air compressor had to run at high flows.

Figure 4: Shown is a special test where the air dryer purge was interrupted by temporarily turning off the air dryer purge. When the purge was interrupted, the air compressor cycles (blue line) went to normal and the air compressor power (average shown in green) dropped by 43%. At the same time, the 75 hp VSD air compressor continued to run at minimum speed, even though it was not required, showing poor air compressor coordination. Click here to enlarge.
Poor Local Connection Practices Revealed
Some local low-pressure shutdowns on critical machines were occasionally occurring which affect production. Overall, the main cause of low pressure in the plant is the air compressor capacity problem, but local issues were also found due to poor local connection practices.
One in particular was mentioned by personnel. Data logging of the input pressure to this machine showed no significant local piping losses between the main line and the pipe drop. However, significant pressure loss likely exists between the piping drop and the actual end use. It can be seen that the FRL component chain of this machine is fed with only flexible plastic tubing, which is not a best practice when it comes to preventing pressure loss during peak flows within the machine. Careful analysis of the capacity of the tubing, filter, regulator, and lubricator needs to be done and compared to the peak demands of the machine to ensure these restrictions are not causing excessive pressure loss.
Compressed Air Leakage Grows in Time
Compressed air leakage represents a constantly growing load on the air compressors as the plant ages, as well as a continuous energy cost. Leak detection using an ultrasonic gun was done in the plant to assess the situation with 32 significant leaks (or uncontrolled end uses) identified. This flow was estimated at 116 cfm.
Flow meters were later installed on the system and showed that the total plant demand during non-production hours was about 300 cfm, representing about 53% of the average plant flow. Obviously not all leakage had been found by the ultrasound test. Some of this flow was due to uncontrolled blowing devices, like compressed air powered vacuum generators left on, and some uncontrolled cleaning flow using flat nozzles left to run during non-production time.
Recommended Solutions for System Efficiency
Some recommended solutions at this site were:
- Remove the system check valves or install remote pressure monitoring on the oil-free air compressor to reduce the rapid cycling.
- Return the undersized temporary rental air compressor and purchase multiple properly sized permanent oil-free units, one air compressor being VSD controlled. The VSD machine would eliminate wasted unloaded power consumption. The air compressors should be chosen to adequately supply peak plants demands, but also efficiently run during average and low loads. Purchase of enough backup capacity so the lubricated air compressors can be taken out of service was recommended. The air compressor sizes should be carefully chosen to prevent control gap that might be caused by a VSD air compressor equal to or smaller than the base units.
- Purchase the new air compressors with heat of compression dryers. This dryer type would eliminate 190 cfm of wasted purge flow and increase the available air compressor capacity.
- Reduce air compressor discharge pressure by 10 psi, and better coordinate air compressor pressure settings so that only one unit runs during light loads.
- Install airless condensate drains on all air compressors, dryers, filters, receivers.
- Better control compressed air vacuum generators so they do not run continuously when there is no production.
- Eliminate or better control blowing devices so they don’t waste air when there is no production or when there is nothing on the conveyor line to blow clean.
- Investigate local pressure problems and upgrade any undersized supply lines to critical production machines.
- Implement a compressed air monitoring system to ensure the compressed air efficiency and leakage levels can tracked.
- Repair 100 cfm in leaks.
The following table details the estimated cost reductions:
|
Load/Unload |
VSD |
|||
|
Measure |
$ Saved |
% Saved |
$ Saved |
% Saved |
|
Air compressor replacement |
$17,035 |
14.2% |
$16,842 |
14.0% |
|
Reduce pressure |
$2,480 |
2.1% |
$3,875 |
3.2% |
|
Fix leaks |
$7,215 |
6.0% |
$10,963 |
9.1% |
|
Convert drains |
$12,420 |
10.4% |
$6,475 |
5.4% |
|
Eliminate dryer purge |
$13,298 |
11.1% |
$20,220 |
16.9% |
|
Reduce end uses |
$2,489 |
2.1% |
$3,417 |
2.8% |
|
Upgrade filters |
$645 |
0.5% |
$577 |
0.5% |
|
Reduce refrig. dryer |
$455 |
0.4% |
$455 |
0.4% |
|
Total |
$56,037 |
47% |
$62,823 |
52% |
Energy Savings and More
This article shows yet another example of the energy savings and cost reductions that can be found by auditing a compressed air system. Not only energy savings are possible, but also improvement in air quality and reduction in production machine downtime. The audit identified the source of the pressure and water contamination problems the plant was experiencing, but the cause was surprisingly not what the company was initially expecting.
For more information about this article, contact Ron Marshall, Marshall Compressed Air Consulting, tel: 204-806-2085, email: ronm@mts.net.
To read similar Compressed Air System Assessment articles visit www.airbestpractices.com/system-assessments.


