On a recent project, at a polyethylene terephthalate (PET) blow-mold and filling operation, a very effective measurement plan resulted in a full synchronization of the supply side air to blow molds with significant reduction in total air use and increases in productivity and quality.
Identifying the Issues
The demand side of the system consisted of four blow molds feeding three separate filler lines. The plant had some significant operational issues they had not been able to resolve.
For beginners, the blow-molds are faster than the filler lines, and during most operations the molds had to stop and start every five to seven minutes. The plant was told they could not adjust the line speeds. On the restart the blow molds would often fault out, or produce rejected bottles.
In the meantime, the total air supply to the blow molds came from two – 800 horsepower (HP) Class 4 stage centrifugal air compressors capable of delivering 1,726 scfm each (3,452 total) at 550 to 580 psig. This airflow was more than ample for four blow molds of which only three operate at any one time. These two air compressors run 24 hours/day, five days a week (6,240 hr/yr). Both units need to remain on whenever there is production due to limited start and stop capabilities.
One question plant decision-makers wanted answered was the size and type of air compressor to add to the system to be able to load and unload as required, without having to constantly run two 800 HP centrifugal air compressors. They also wanted to know the proper size trim unit needed to be able to effectively unload and save energy when the air demand is lower.
A four-stage double acting, water cooled, reciprocating 500 HP air compressor rated to deliver 1,100 to 1,200 scfm at 550 – 580 psig as a trim unit was recommended. The demand was perceived to be too high for the two 800 HP units because of the falling pressure when they were at full load. The plan was to have the centrifugal air compressors at base and trim with the new reciprocating unit.
The plant manager felt the plant needed more definitive support data to make this large capital expense and called in consultants to implement a full evaluation.
Developing an Action Plan
The consulting team conducted an analysis and recommended a number of steps to gather the data needed to optimize the compressed air system and achieve energy savings.
As a first step, the plant needed to install input kW loggers on each operating air compressor. It also needed to install flow meters in the air compressor room, and AFTER the refrigerated dryers. Additionally, the plan called for the installation of pressure transducers and loggers at the air compressor discharge; at the dryer entry; at the dryer exits; at the entry to the blow mold and after the blow mold high-pressure inlet regulator discharge inside each blow mold.
The team then instructed the plant to set this measurement equipment to record all data simultaneously with one-second data prints for diagnostics.
Next, the plant needed to establish an accurate best-case demand scenario for the measured conditions. To do so, it needed to identify the calculated air demand of each operating blow mold while considering operating pressure, production level in bottles/ hour, container size, and blow air recovery. The following table outlines how this was accomplished.
Bottling Blow Mold Calculated Air Demand Profile with Blow Air Recovery
Table 1
|
Blow Mold Line / Model |
#5 (24 oz.) 48,000 bph |
#4 (2 liter) 22,000 bph |
#3A (20 oz.) 30,000 bph |
#3B (20 oz.) 30,000 bph |
|
Blow Air (scfm) – 32 Bar |
1007 |
1042 |
524 |
524 |
|
Pre- |
406 |
184 |
208 |
208 |
|
Stretch (scfm) – 7 Bar |
270 |
474 |
180 |
180 |
|
Service (scfm) each – 7 Bar |
125 |
100 |
100 |
100 |
|
Air Required at 464 psig / 32 Bar (scfm) |
1,007 |
1,042 |
524 |
524 |
|
Air Required to 100 psig / 7 Bar (scfm) |
801 |
836 |
488 |
488 |
|
Total Delivered at 464 psig / 32 Bar (scfm) |
1,808 |
1,878 |
1,012 |
1012 |
|
Projected Blow Air Recovered (scfm) |
(403) |
(416) |
(210) |
(210) |
|
Projected Net High Pressure Required with 40% Blow Air Recovery |
1,405 |
1,461 |
802 |
802 |
Table 2
|
Blow Mold* Net scfm Demand (470 psig or more to blow mold /464 psig inside blow mold) |
||
|
|
Calculated (scfm) |
Measured Actual (scfm) |
|
#5 |
1,405 |
1,380 |
|
#4 |
1,461 |
1,390 |
|
#3A * |
802 |
1,100 |
|
#3B * |
802 |
1,100 |
|
* Net flow includes 40% blow air savings. |
||
There are four blow-mold machines at the plant. Lines #3A and 3#B always run together. Either line #4, or line #5, runs with lines #3A and #3B.
The calculated maximum demand for high-pressure air use with 40% recovery to the blow air would be between 2,500 scfm to 2,600 scfm at 550 psig to cover both of these conditions.
Utilizing the Control Board Flow Data on each blow mold (Table 2) shows that lines #4 and #5 run just a little lower than the calculated flow. However, lines #3A and #3B each run almost 300 scfm higher than calculated.
With the current piping arrangement the team could not determine if the 210 scfm of blow-air recovery from each mold was actually being utilized. The maintenance indicators all said it was. Observation of the operation identified very significant leaks within line #3A and #3B blow molds.
Gaining Accurate Insights
The team gained invaluable insights that led to an accurate flow-pressure operating profile.
Table 3
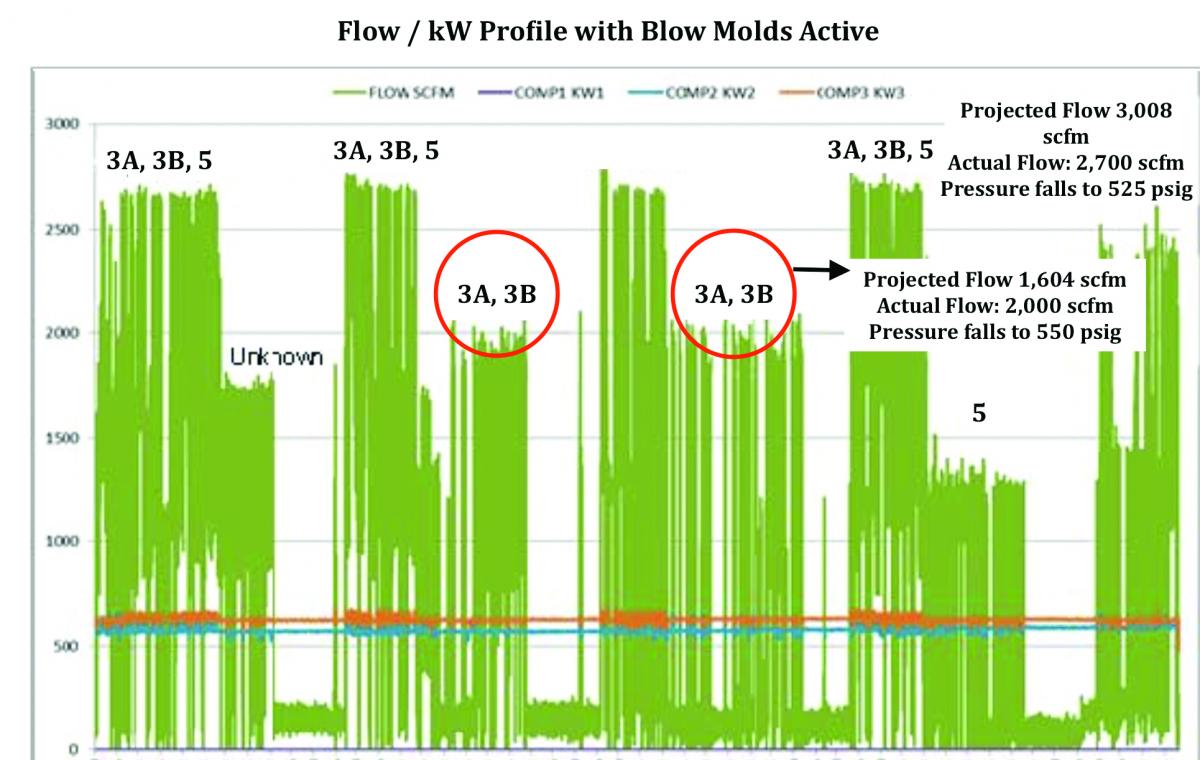
Very critical data is shown in Table 3. One highlight of the data is that maximum flow into the system is 2,700 scfm and the pressure falls. The two centrifugal air compressors at full load together are rated at 3,532 scfm, but can only deliver 2,700 scfm. Also, the blow molds start and stop with continuing four– to six-minute cycles. The blow mold production speeds are too far ahead of the filler speed.
Table 4
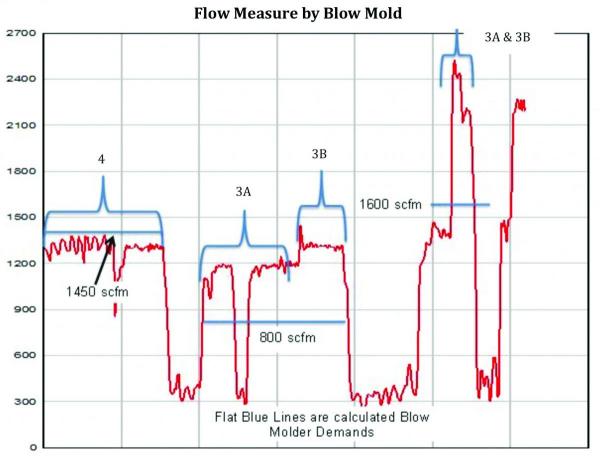
As shown in Table 4, blow mold #4 is measured at 1,461 scfm compared to a calculated 1,405 scfm; blow mold #3A is measured at 1,200 scfm compared to a calculated 800 scfm; and blow mold #3B is measured at about 1,300 scfm compared to a calculated 800 scfm.
Table 5
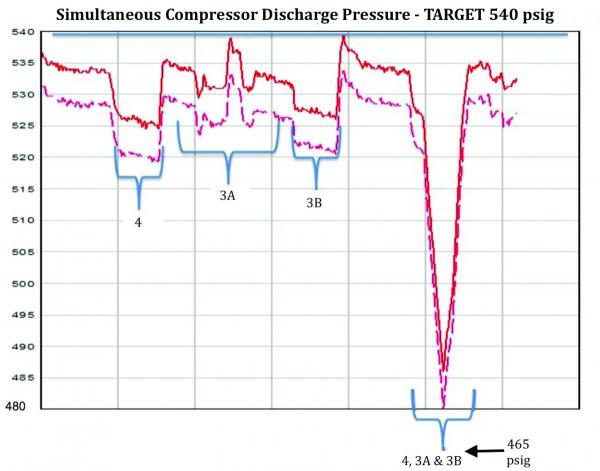
Table 5 shows the discharge pressure of each air compressor with two of three blow molds operating. The most the system can hold is 520 to 530 psig. When all three blow molds are operating together both compressors fall to 465 psig.
The measurements led to a number of important conclusions. Beginning with the evaluation of air demand, blow molds #4 and #5 appear to confirm that the calculated net flow, including the blow air recovery, are accurate. Blow molds #3A and #3B running together measure 2,200 scfm to about 2,400 scfm compared to a calculated 1,600 to 1,700 scfm.
Recommended action to be taken included an investigation and repair of leaks. When the leaks are repaired the plant needed to stabilize at the proper demand. In addition, it needed to monitor the airflow and inlet pressure to all blow molds. An evaluation of the air supply concluded:
- Total air supply required at 550 to 580 psig with one centrifugal air compressor delivering rated flow, one centrifugal in backup and one correctly sized trim at 3,200 to 3,300 scfm.
- Total maximum calculated load with monitored and well maintained blow molds operating either line #4 or #5, and both #3A and #3B.
- The proper type and size for the trim unit would be a three-step unloading, double-acting reciprocating water cooled unit delivering 1,500 to 1,600 scfm at 550 to 580 psig.
This will deliver a total 3,250 to 3,350 scfm with the maximum demand from 3,000 to 3,100 scfm, with one centrifugal air compressor at base load and the other in back-up mode. Doing so will reduce the total input energy significantly. The original suggestion of a 1,050 to 1,100 scfm trim unit would have been too small.
Addressing Key Questions
The project addressed three key questions:
- What can be done to eliminate the frequent starts and stops? One solution is to increase the bottle storage convey line. Another is to lower the blow mold speed closer to the filler speed. This not only will lengthen the run times but will also reduce the air demand. In other words, lower the speed 10%, reduce the air demand 10%. This speed adjustment was accomplished by adjusting the speed, controls, and the ovens properly.
- Why can’t the two centrifugal air compressors deliver their full capacity? This is a question that speaks strictly to a piping issue.
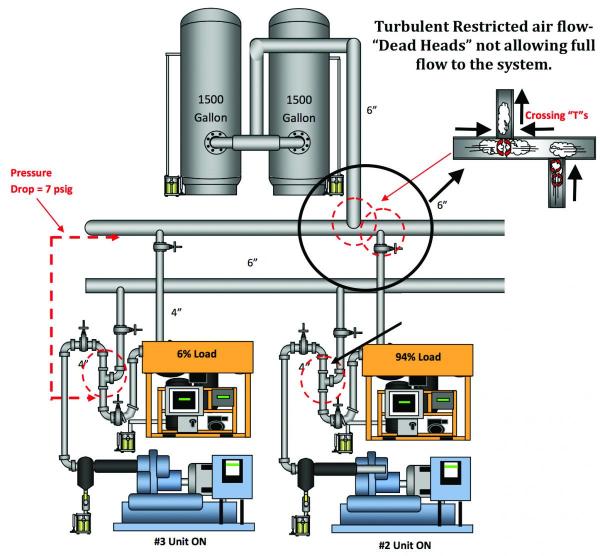
Figure 1 shows the basic piping size and configuration. The red circles identify a “crossing tee” and “dead head” with converging flows to the 6-inch header, which creates turbulent resistance to flow and backpressure and reduces the full load mass flow from 3,532 scfm to 2,700 scfm to 2,800 scfm.
Figure 2
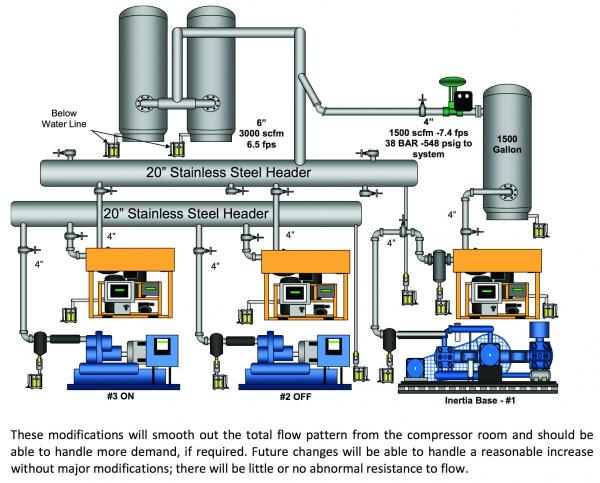
Figure 2 shows the correct way to eliminate this basic piping issue. More importantly the system uses a positive displacement trim unit with a dynamic centrifugal air compressor. The team also eliminated any interference to the centrifugal air compressor by running the positive displacement unit to a receiver and tying the discharge line downstream at an angle into the primary air receivers.
Note the centrifugal collector headers for the discharge were increased from six inches to 20 inches to reduce the transfer of velocities.
3. What is the basic cause and correction for the extreme pressure drop (465 psig)?
This condition is depicted in the following two graphs:
Figure 3
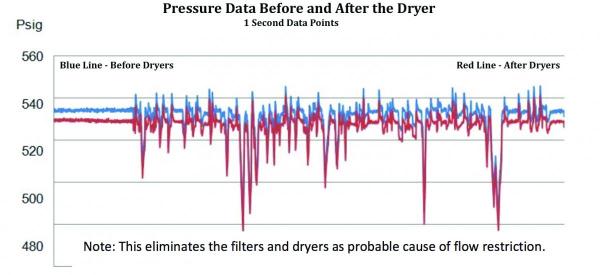
Figure 3 shows pressure before and after the dryer. The âP is an approximate constant five psig, which may seem high, but since it is a steady differential it probably is not a fouled dryer, or filter separator, causing the pressure loss.
Figure 4
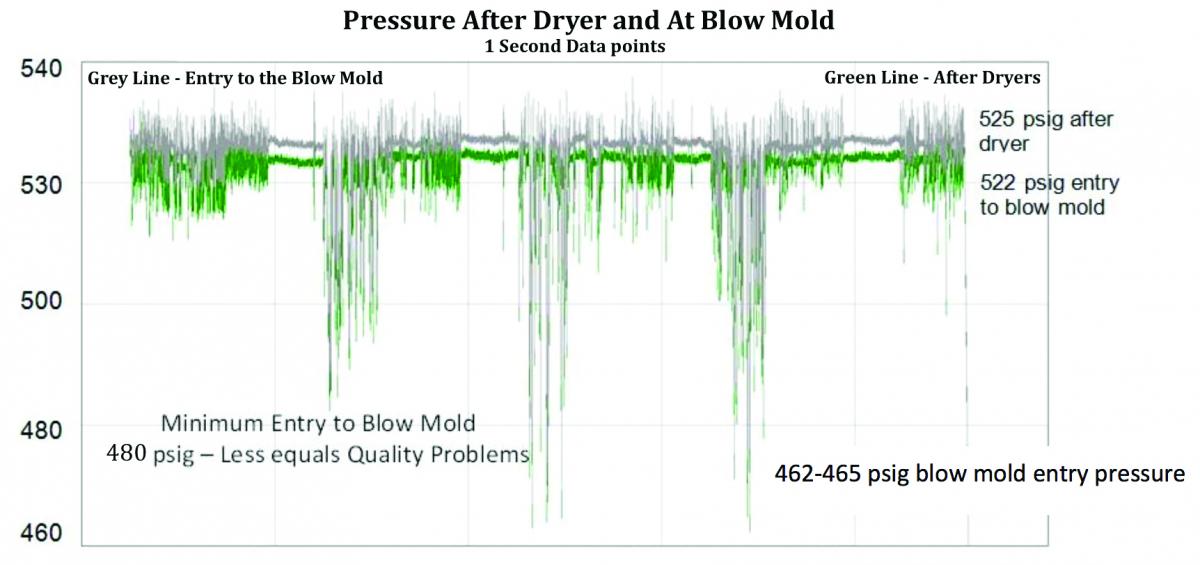
Figure 4 shows pressure after the dryer and at blow mold entry. The blow molds require a minimum entry pressure of 480 psig, however, this cannot be delivered with the three blow molds running constantly. At 465 psig and lower the blow mold shuts off.
Identifying the Problem
Storage: Total current effective storage 3,100 gallons (414 cu. ft.) at 550 psig maximum. Allowable pressure loss to avoid low-pressure problem in blow mold = 480 psig.
The Formula to calculate decay time: Time = (414 cu. ft.) (550 – 480 psig)
With 400 scfm net flow out (400 cu. ft.) (14.38 psig)
Net flow currently delivered from air compressors (best possible) = 2,700 scfm with demand of 3,100 gallons.
The total 2,700 delivered was 400 scfm short. The calculated tank holding time was five to six minutes in a best-case scenario by applying the stored air to the shortage.
If the blow molds continue to run more than six minutes, the system pressure will fall below 480 psig as it is now doing.
Lack of Effective Storage
Another issue to address was the lack of effective storage. The current storage cannot sustain a continuous three- or even two-blow mold run. It is also too small to allow the system to hold pressure during the permissive reload time for the centrifugal air compressor to unload and then load in during stoppages and reload.
Based on observations and according to plant personnel, the plant is currently experiencing bottle rejects due to low-pressure issues particularly during the blow mold startup run.
To address the issue, storage increased from 414 cu. ft. to about 1,000 cu. ft. The probable worst-case scenario is with three blow molds on and with both #4 or #5 blow molds remaining off. The flow drops about 1,400 scfm and there is only the 1,600 scfm demand left of lines #3A and #3B (after repairs). Currently one centrifugal air compressor goes to full blow off, but will have to reload once the blow mold starts up.
A blow mold takes 1.5 minutes from start to full flow demand and to activate the blow air recovery system. The initial demand will be low and then it increases to about 1,800 scfm, then finally falling to 1,400 scfm as the blow air recovery system engages.
The high-pressure centrifugal air compressor blow off/inlet value control requires about three minutes from full blow off to full load. Any signal delay from the blow mold start to the air compressors will add to this permissive load time.
The new reciprocating unit’s permissive reaction time from no-load, to 50% load, to 100% load is much less than a minute, but short cycling of less than one minute isn’t wanted since it could cause higher maintenance issues. The modified storage increase will allow this, regardless of which units are online operating the trim from 550 psig to 580 psig and regulating the flow to 548 psig. With the centrifugal air compressor set at 550 psig at full load during three blow molds the operation should do well.
Under these given conditions:
Time = (1,000 cu ft.) (550 – 480 psig)
(1,400 cu ft.) 14.38 psig
Time = almost 3.8 minutes even at a 1,400 scfm net flow out
Holding the maximum pressure discharge from 550 psig to 480 psig, this storage allows over 3.5 minutes in the worst-case scenario. In the anticipated one-minute cycle time of the reciprocating unit, the pressure will only fall about 2 psig.
Since the high-pressure air system is dedicated to the blow mold process, if a central air monitoring and management system is installed, a combination load/unload signal can be set up to activate from the blow mold start/stop signal, further enhancing the timing between compressed air supply and the blow molds.
Final Thoughts
With proper data and understanding of the various operating dynamics of key equipment processes – what was deemed almost incomprehensible – became clear and a path to success became obvious.
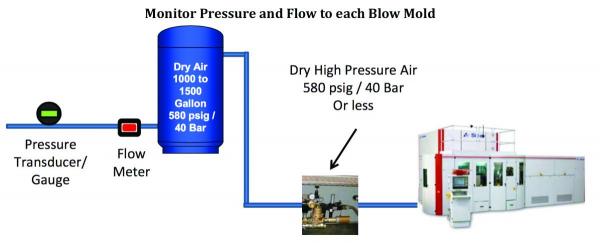
After the system is balanced, it is important to monitor the key performance indicator, set the “red flags” and take timely corrective action. For PET blow mold monitoring we recommend at the every least monitoring pressure and flow to each blow mold. Then, compare it to the calculated standard. Do not allow demand to grow. Proper flow measurement to the blow mold should be ahead of the air receiver as shown in Figure 5 below. If not available on the control board, the air receiver will help eliminate low internal pressure problems in the blow mold.
Figure 5
Keep in mind this exercise involved a high-pressure PET production process, yet it does not matter what the pressure, production, or the process is. The strategy works when the goal is to balance any system with proper measurement and data.
We hope you’ve found this interesting and look forward to your comments! Contact Hank van Ormer, email: [email protected], tel: 614.580.2711
To read similar System Assessment End Use articles visit www.airbestpractices.com/system-assessments/end-uses or to read all articles of this series:
Missed Demand-Side Opportunities Part 1 - Flow Restrictions from Pipe Headers
Missed Demand-Side Opportunities Part 2 - Integrating Multiple Air Compressor Controls
Missed Demand-Side Opportunities Part 3 - Controlling Open Blowing with Compressed Air
Missed Demand-Side Opportunities Part 6 - Look to AODD Pumps To Lower Compressed Air Demand
Missed - Demand-Side Opportunities Part 7 - The Importance of System Pressure Control